What's in store for the rest of 2022 into 2023
As we monitor the start of the busiest time of year for Retail sales, we look to The Crowd to indicate what the next few months will bring. Leveraging HundredX’s proprietary listening methodology, we evaluate more than 230,000 pieces of feedback from real customer experiences across the country. Focusing on the Apparel sector, we develop insights into future Net Purchase Intent (NPI), the sentiment drivers behind changes in intent, and Customer Satisfaction (CSAT).
Key Takeaways
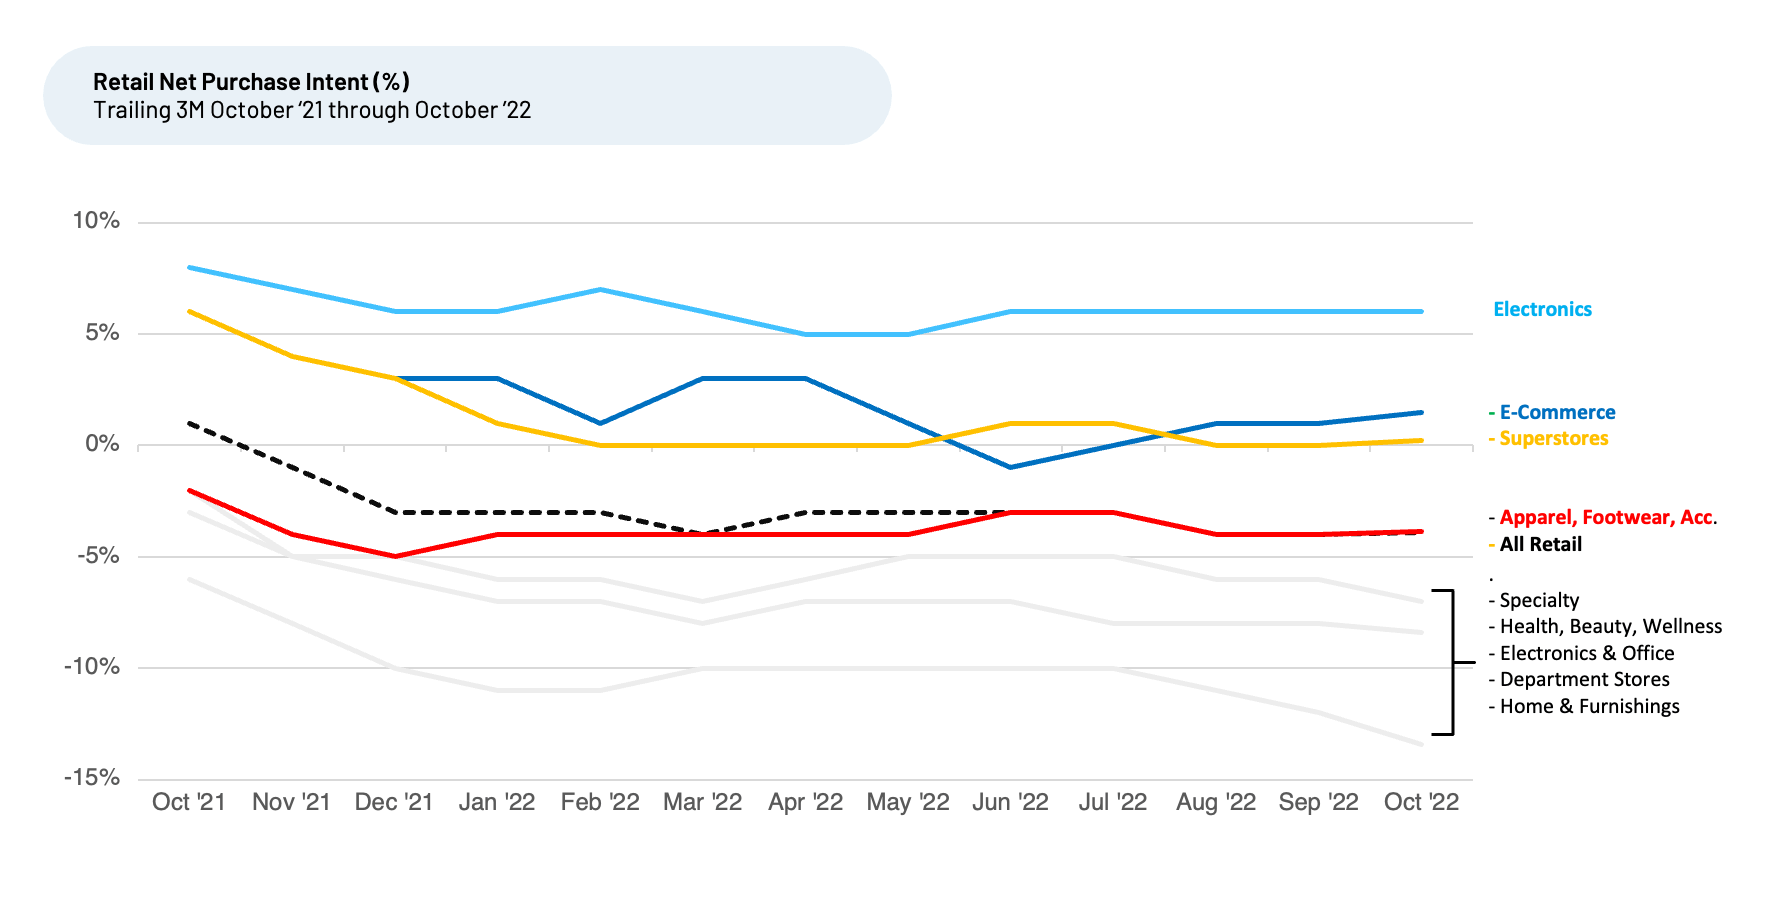
- Apparel NPI remains stable, while other Retail sectors, such as Specialty and home furnishing show declines. Meanwhile, E-commerce is gaining.
- A number of specific brands within the Apparel sector see improving NPI. The brands with the largest month over month gains: DXL, Savage X Fenty, bebe.
- Despite lower NPI, Customer Satisfaction (CSAT) for Apparel (4.5 on a 5-point scale) remained steady over the past year. Apparel’s CSAT score is one of the top measures for any sector in our coverage.
- Top Apparel retailers do a great job of satisfying customers on Comfort, Quality, and Styles -- the most important drivers of customer satisfaction for the industry.
Apparel growth likely to remain stable and lower than
E-commerce, which is improving
We observed a broad pullback in overall consumer Retail Net Purchase Intent during the past year, falling from 1% trailing three months ended (T3M) October 2021 to -4% T3M October 2022. During the last six months, this trend became more pronounced across almost every Retail sector. Overall Apparel NPI remained stable in October 2022, indicating growth for retail sales for clothing and accessories stores, as reported by the Census Bureau, is likely to remain low single digits in the coming months. Reported growth in that category was 2%–4% for July to September 2022 versus the prior year, down from 20%+ in the first quarter 2022.
As a reminder, NPI reflects the percentage of customers who plan to purchase more of a brand during the next 12 months minus the percentage that plan to purchase less. The monthly retail sales data reported by the US Census Bureau for 10 sub-sectors HundredX covers has an average correlation of about 70% with the NPI data for those industries. We find changes in the direction of NPI tend to occur two to six months before the same trend occurs for reported retail sales figures.
NPI for E-Commerce is one Retail group that has seen improvement during recent months and is positive overall, at 1% for T3M October 2022, up from -1% in June 2022. We believe modestly positive NPI, along with its gains over other sub-sectors that remain flat to down, indicates consumers will most likely continue to spend more money on E-commerce relative to other Retail areas. Year-over-year growth in Retail sales for Electronic shopping improved every month, moving from 8% in May 2022 to 14% in September 2022. These strong rates should remain sustainable and may even improve further during the coming months.
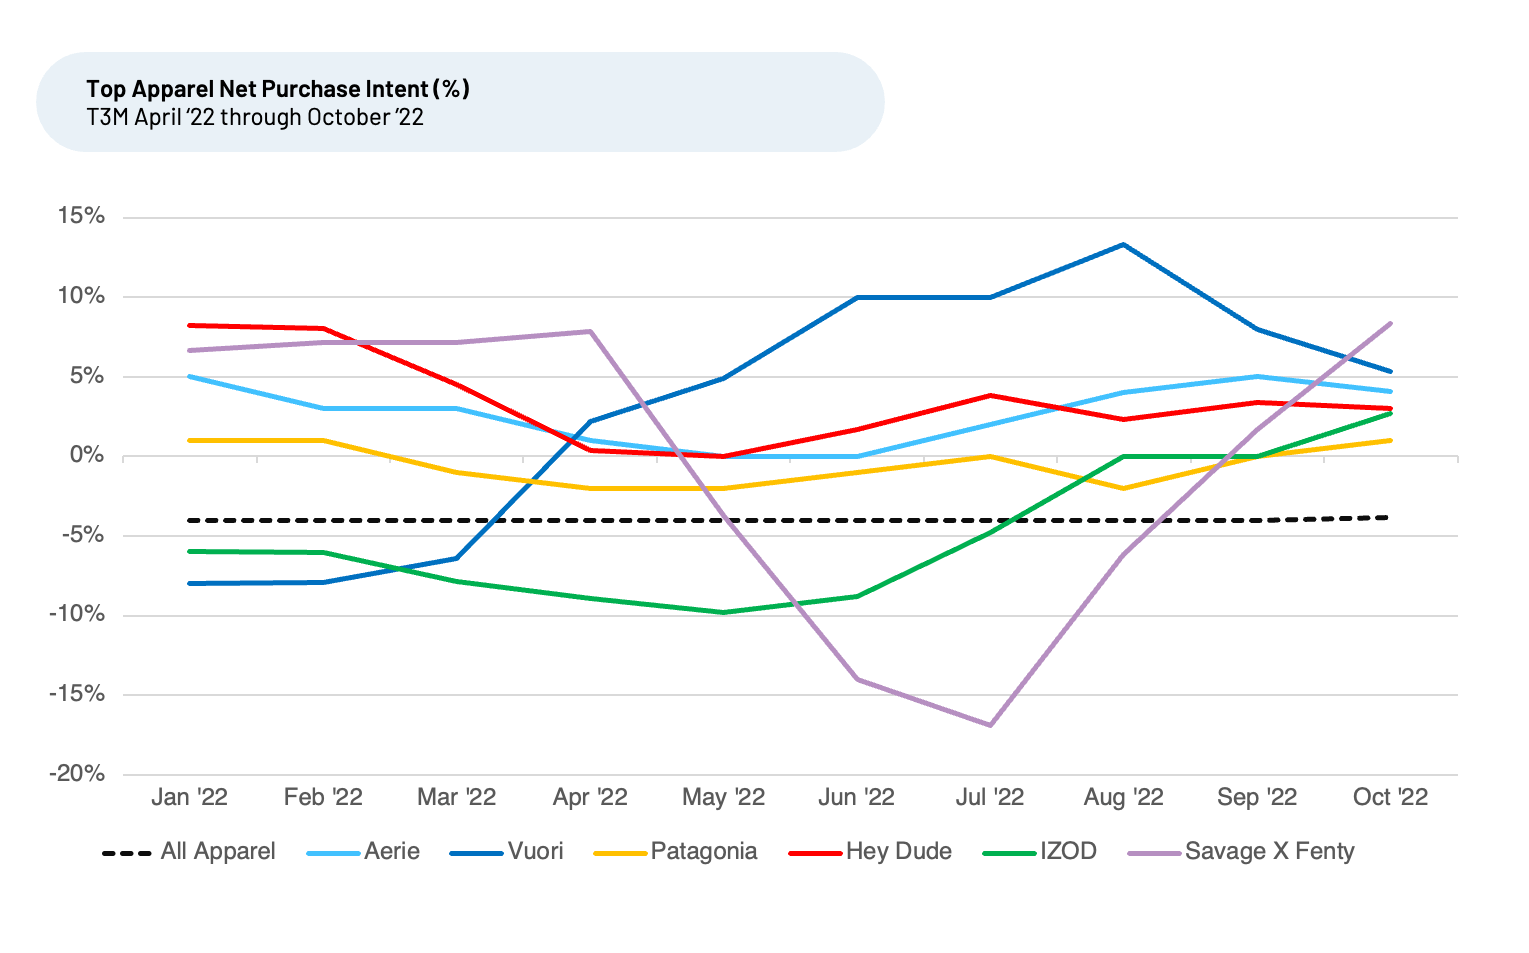
Despite the overall Apparel industry remaining flat on NPI, we do see certain brands within the industry showing positive NPI changes, implying they will likely see improving growth and market share. Analyzing the entire Apparel group, The Crowd intends to spend more with the following brands.
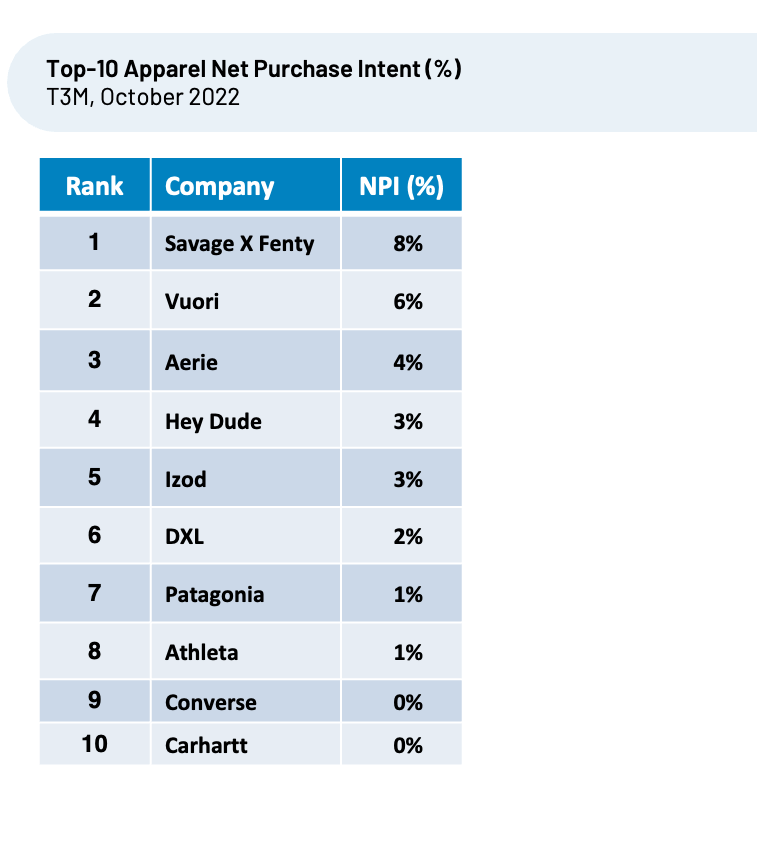
Apparel NPI Highlights
- Savage X Fenty, singer Rihanna’s fashion line, debuted its fourth show on Amazon this month. Ahead of the show, we saw overall NPI for the popular brand is up from a July low of -17% to +8% T3M October 2022, levels last seen in January 2022. Over the last six months, we saw the brand significantly improve on sentiment vs. peers on Availability, Comfort, Online Ordering, and Value.
- Aerie rose from 0% in June 2022 to +4% T3M October 2022. The brand increased spending on TikTok, Instagram, Snapchat, and other social media channels while using inclusive ads and no retouched photos. Over the last six months we saw the brand significantly improve on sentiment vs. peers on Styles, Selection, and Brand Image.
- Hey Dude, a recent acquisition by Crocs, saw its NPI rise from 0% May 2022 to 3% for T3M October 2022. The brand, which appeals to teenagers and older GenZ, almost doubled sales year-over-year. Over the last six months we have seen the brand significantly improve on sentiment vs. peers on Price, Styles, Quality and Selection.
- Patagonia increased NPI from -2% April 2022 to 1% T3M October 2022. The outdoor apparel company recently announced it will now be in the hands of a trust and a nonprofit organization. All future profits will be donated to help fight climate change. Over the last few months, we saw the brand significantly improve on sentiment vs. peers on Brand Values/Trust and Brand Image.
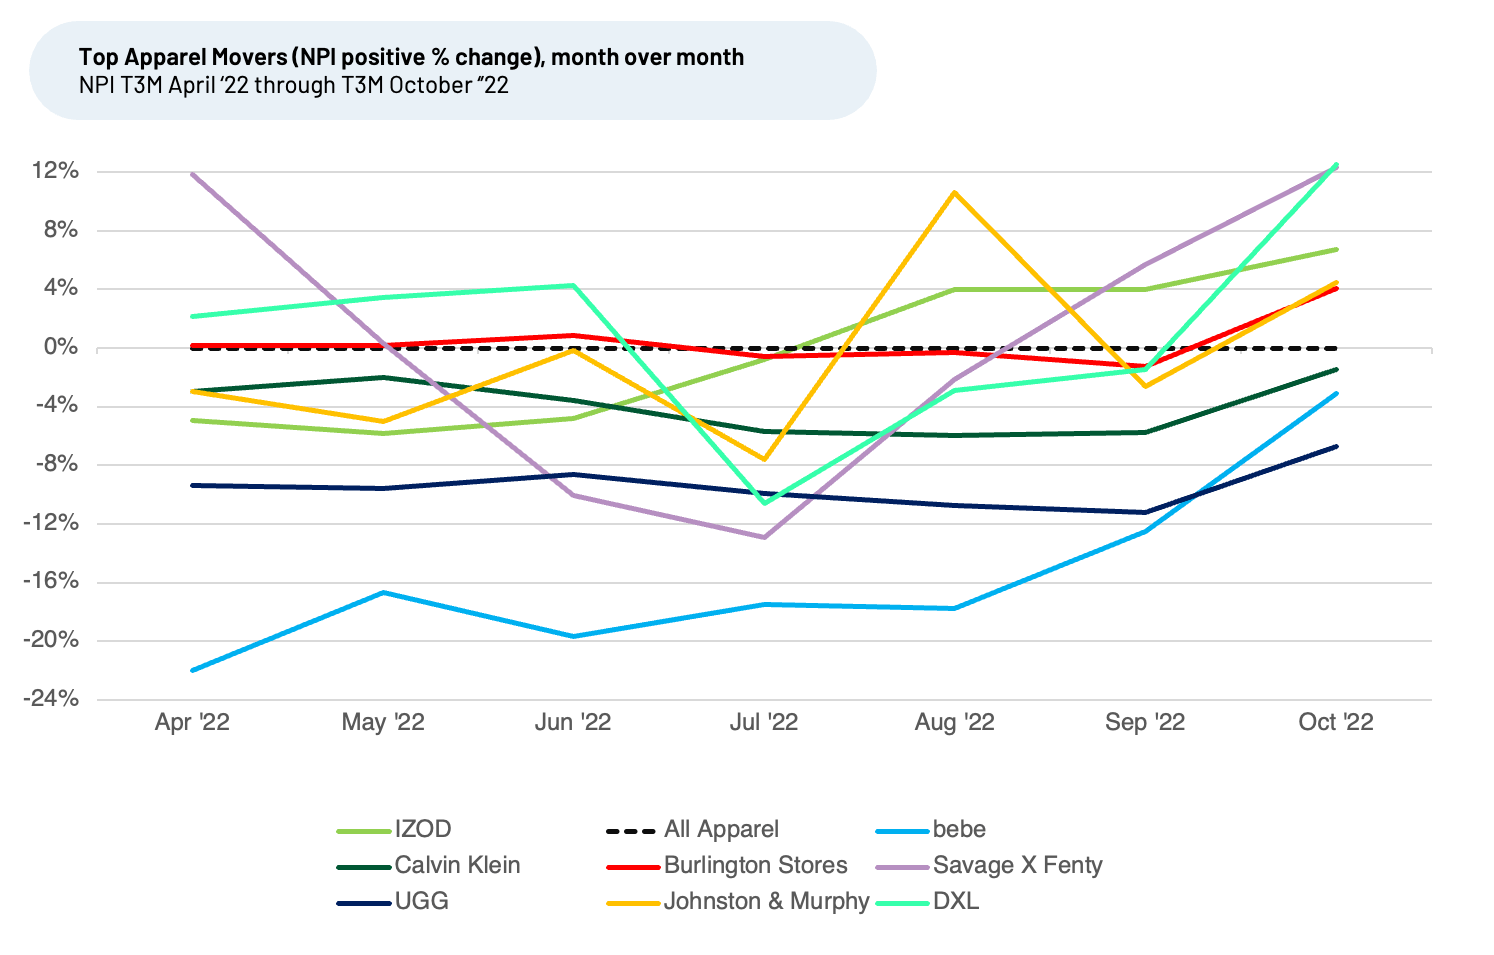
Apparel's largest NPI improvers for trailing three-month period October 2022
When we compare trends in a brand’s NPI relative to the Industry NPI, we find the top performers who gain in NPI relative to bottom performers tend to gain market share within a sector. A number of brands within the Apparel sector appear to continue gaining market share, indicated by positive change growth above the sector’s average.
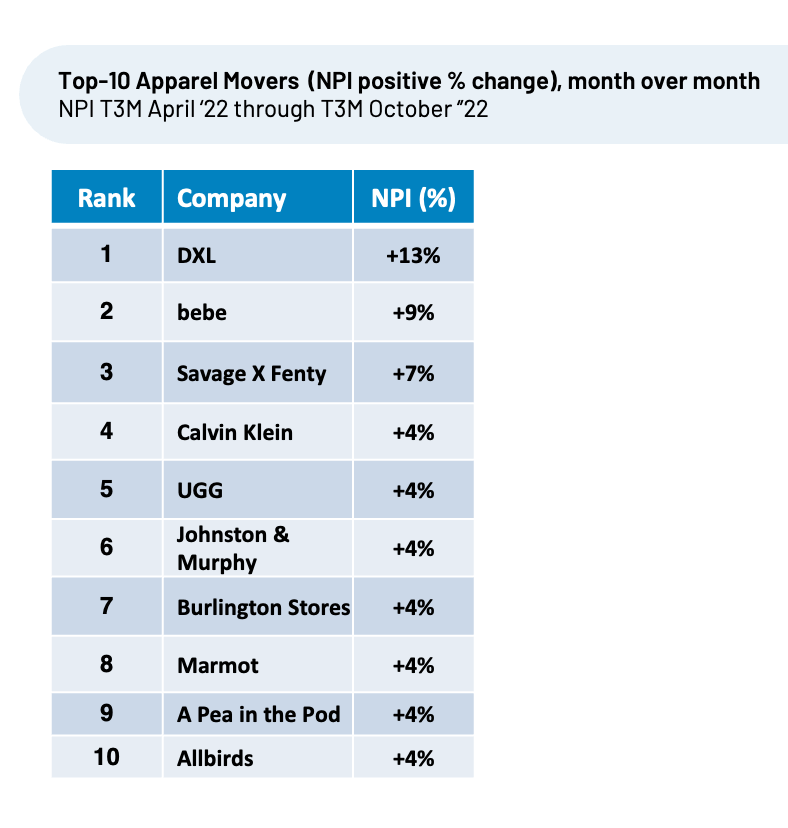
We also show select positive change for brands that still may have lower overall NPI but saw customers’ purchase intent change much more than the rest of the group.
Top Apparel NPI Mover Highlights
- Izod, acquired by Authentic Brands Group last year, recently increased licensing and marketing efforts, and its NPI has increased from -6% in May ’22 to +7% in October ’22. Over the last six months we have seen the brand significantly improve on sentiment vs. peers on Price, Comfort, Selection, and Coupons/Promos.
- UGG, owned by Decker’s Corp., saw positive gains in the last two months. UGG relies upon later seasonal quarters for the bulk of its sales and has remained a growth driver for Decker’s. Industry analysts have said the company has been benefiting from a brand first focus, compelling new products, and improving DTC/Omni-Channel consumer engagement and sales. Over the last six months we have seen the brand significantly improve on sentiment vs. peers on Comfort and Quality.
- Destination XL (DXL), which targets the underserved men’s XL clothing category, climbed from -10% in July ’22 to +12% in October ’22. The company adjusted brand positioning to focus on more than just selling clothing, and instead to “… (help) our customer to find and define his style, which allows him to express his personality, and live his best life. We do all this in more personalized ways, which we believe will fuel greater customer loyalty and propel our growth in the future.” Over the last few months, HundredX saw the brand significantly improve on sentiment vs. peers on Sizes & Fit, Associate Attitude, Cleanliness, and Availability.
Apparel Customer Satisfaction
We also find Customer Satisfaction (CSAT) for Apparel (4.5) remained steady over the course of the last year, one of the top measures for any sector in our coverage. HundredX measures CSAT on a 5-point scale.
Sentiment towards a driver of CSAT is measured by Net Positive Percent (NPP), which is the percentage of customers who say a driver (such as Quality or Price) is a reason they like a brand/product minus the percentage who say it is a reason they do not like it. The top factors driving Apparel customer satisfaction, and the reason why they prefer a specific brand include Comfort (chosen as top driver 70% of the time), Quality (67%), Styles (67%), Sizes & Fit (66%), Durability (65%), and Brand Image (52%).
While The Crowd tells us that the overall outlook for Retail purchase intent will most likely continue its mixed trend, with Retail continuing to show negative or little NPI growth, select Apparel brands will gain market share relative to the broader sector. We continue to monitor trends within Retail, Apparel, and other areas to see if any changes emerge as the shopping season progresses as well as into 2023.
Strategy Made Smarter
HundredX works with a variety of companies and their investors to answer some of the most important strategy questions in business:
- Where are customers "migrating"?
- What are they saying they will use more of in the next 12 months?
- What are the key drivers of their purchase decisions and financial outcomes?
Current clients see immediate benefits across multiple areas including strategy, finance, operations, pricing, investing, and marketing.
Our insights enable business leaders to define and identify specific drivers and decisions enabling them to grow their market share.
Please contact our team to learn more about which businesses across 75 industries are best positioned with customers and the decisions you can make to grow your brand’s market share.
####
HundredX is a mission-based data and insights provider. HundredX does not make investment recommendations. However, we believe in the wisdom of the crowd to inform the outlook for businesses and industries. For more info on specific drivers of customer satisfaction, other companies within 75+ other industries we cover, or if you'd like to learn more about using Data for Good, please reach out: https://hundredx.com/contact.
Share This Article