While the Golden Age of department stores ended decades ago, they still sell to millions of American consumers each year, delivering a wide selection of clothing, beauty products, footwear, jewelry, and accessories at discounted prices. We look to “The Crowd” to understand how relative demand trends may impact the mix of products sold in department stores and why.
Analyzing more than 300,000 pieces of customer feedback covering 100+ retail brands since August 2021, we find:
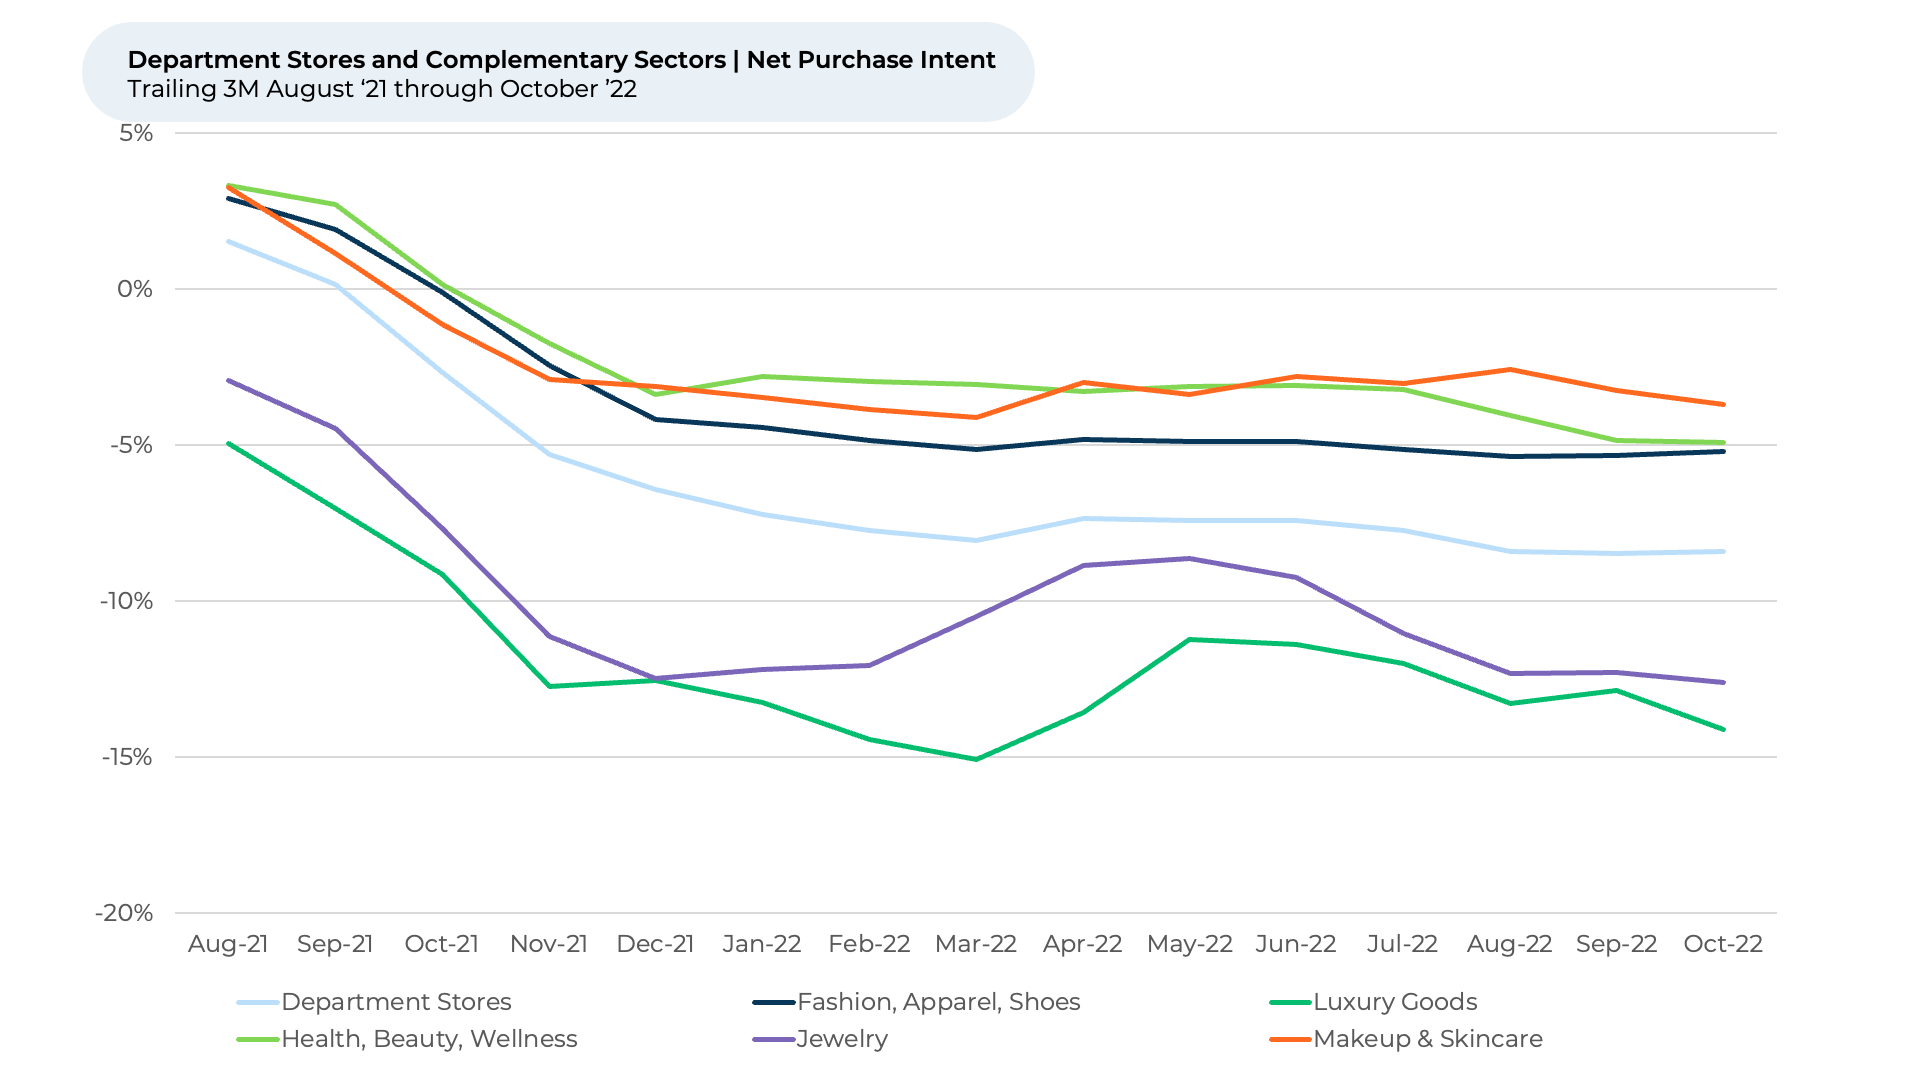
- Department Stores' Net Purchase Intent (NPI) remains stable since the trailing three months (T3M) March 2022 period, even as complementary industries dipped.
- High-end segments Luxury Goods and Jewelry experienced declining NPI starting T3M June 2022, while Fashion has remained very stable.
- We observed some pullback in NPI for Health, Beauty and Wellness (since T3M August 2022) and Makeup & Skincare (since T3M September 2022), but not to the extent of the luxury-focused sectors.
- Pricing appears to be a big reason department stores have not seen as much of a decline in their growth outlooks as other sectors in recent months.
Gauging Purchase Intent
We find NPI, our leading indicator of demand growth outlooks for businesses, slumped from T3M August 2021 to T3M December 2021 for Department Stores and the fashion-related retail sectors we track. The recent stability in NPI for Department Stores indicates growth in retail sales for the sector will probably remain around the 0% levels reported in August 2022 for the next 3-6 months.
NPI fell for Department Stores by almost 10% from 2% for T3M August 2021 until stabilizing at -8% for T3M March 2022, where it has remained through T3M October 2022. Growth in monthly retail sales for the Department Store sector declined over the same period, falling from 53% versus the prior year in August 2021 to 26% in March 2022, stabilizing around 1% for July 2022 and 0% for August 2022, the latest month reported by the U.S. Census Bureau.
As a reminder, NPI for the retail industry reflects the percentage of customers that plan to spend more at a store over the next twelve months minus the percentage that plan to spend less. The monthly retail sales data reported by the U.S. Census Bureau for 10 sub-sectors HundredX covers has an average correlation of about 70% with the NPI data for those industries. We find changes in the direction of NPI tend to occur two to six months before the same trend occurs for reported retail sales figures.
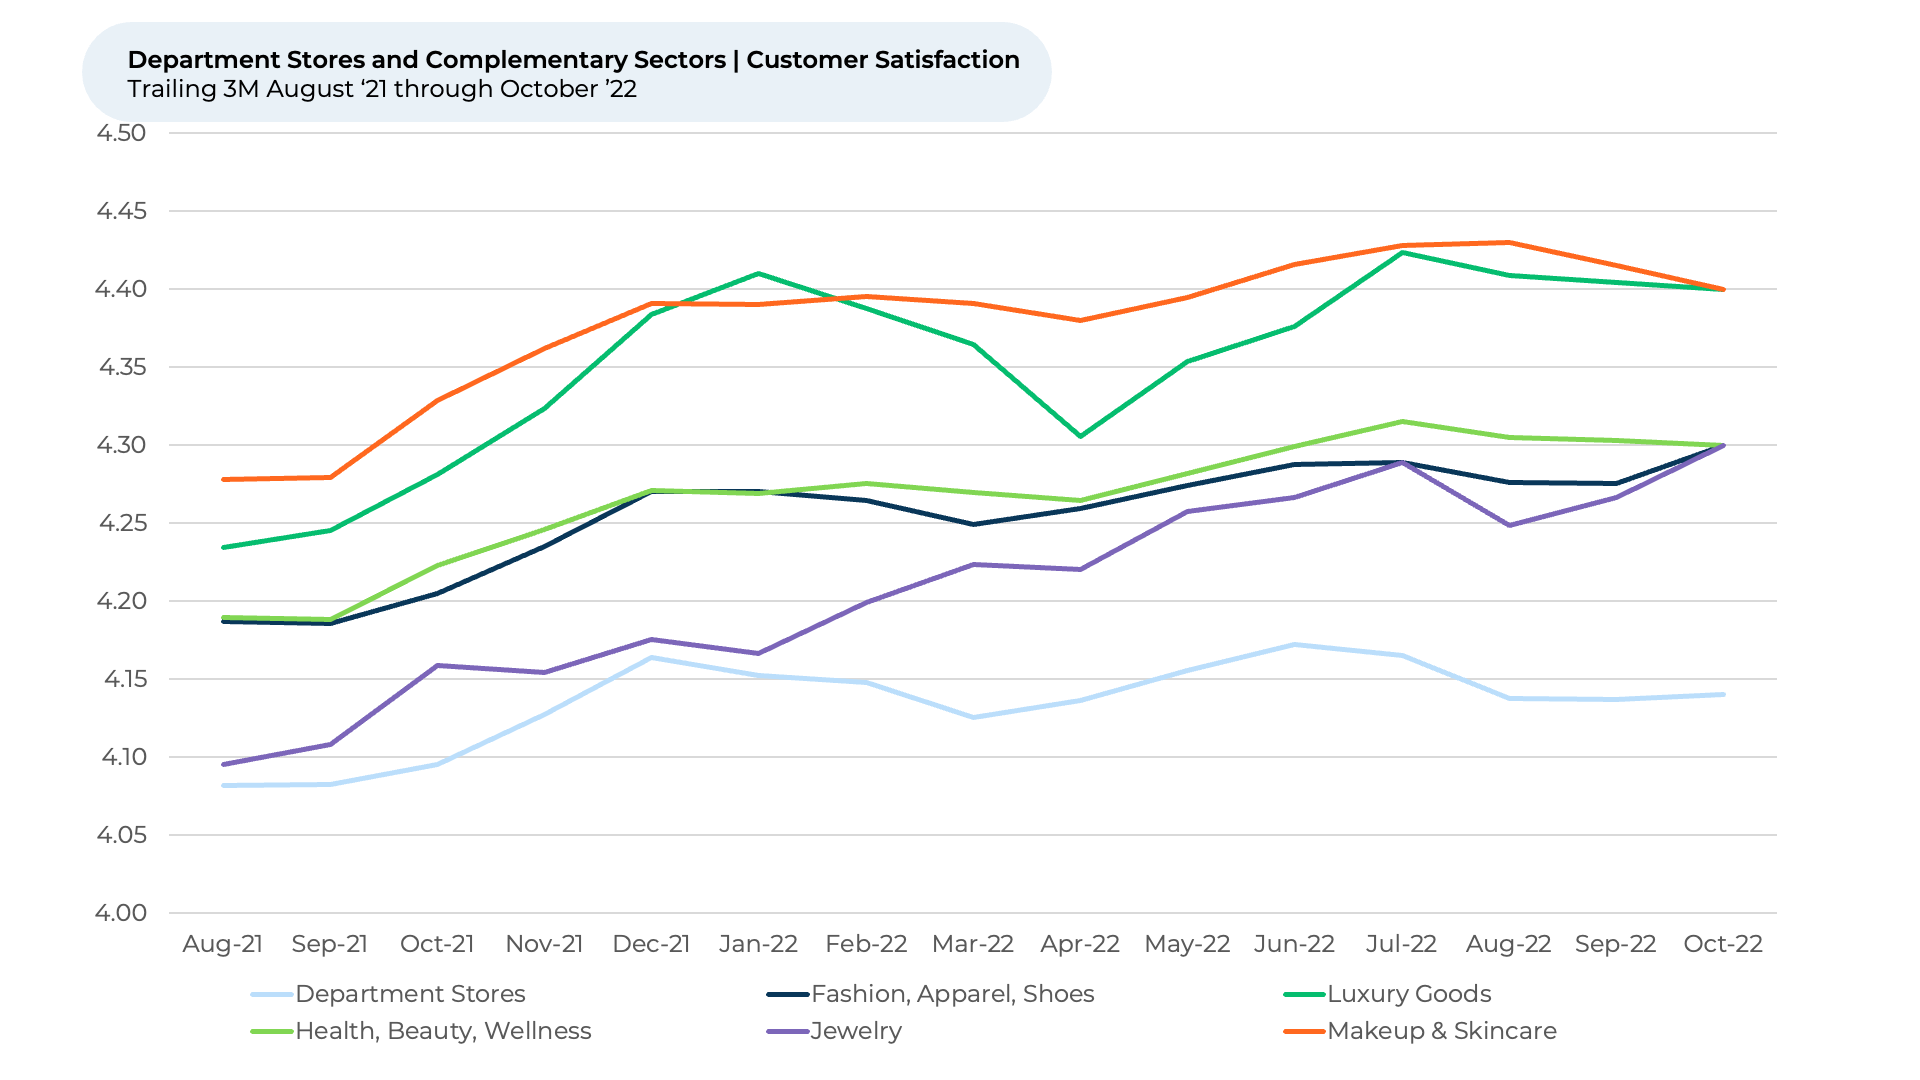
We also find Customer Satisfaction (CSAT) for Department Stores has been improving slightly over the course of the last year, but it has not improved as much as the other fashion-related sectors and remains at the bottom of the pack, meaning the other sectors do a better job of pleasing their customers. HundredX measures CSAT on a 5-point scale.
We investigate “the why behind the buy”, finding the brands that do best on Price, Selection and Styles tend to delight their customers the most across department stores, apparel, apparel accessories, and beauty sectors.
Price
At a time when U.S. consumers have become increasingly concerned about how far their wallet stretches, “the Crowd” indicates pricing is a big reason department stores have not seen as much of a decline in their growth outlooks as other sectors in recent months. Department Stores seemingly won customers over on price -- when it comes to consumers’ sentiment on price, sporting a 14% Net Positive Percentage (NPP) on Price T3M October 2022. NPP represents the percentage of customers who selected a factor (or driver) as a reason they liked a product or service minus the percentage who saw it as something they did not like.
Department stores, which can be up to 250,000 square feet, offer a huge array of clothing brands at numerous price points. For example, Macy’s, the long-standing American department store, sells brands ranging from the affordable Columbia to Polo by Ralph Lauren and Calvin Klein, to Hugo Boss – running a wide gamut on price points.
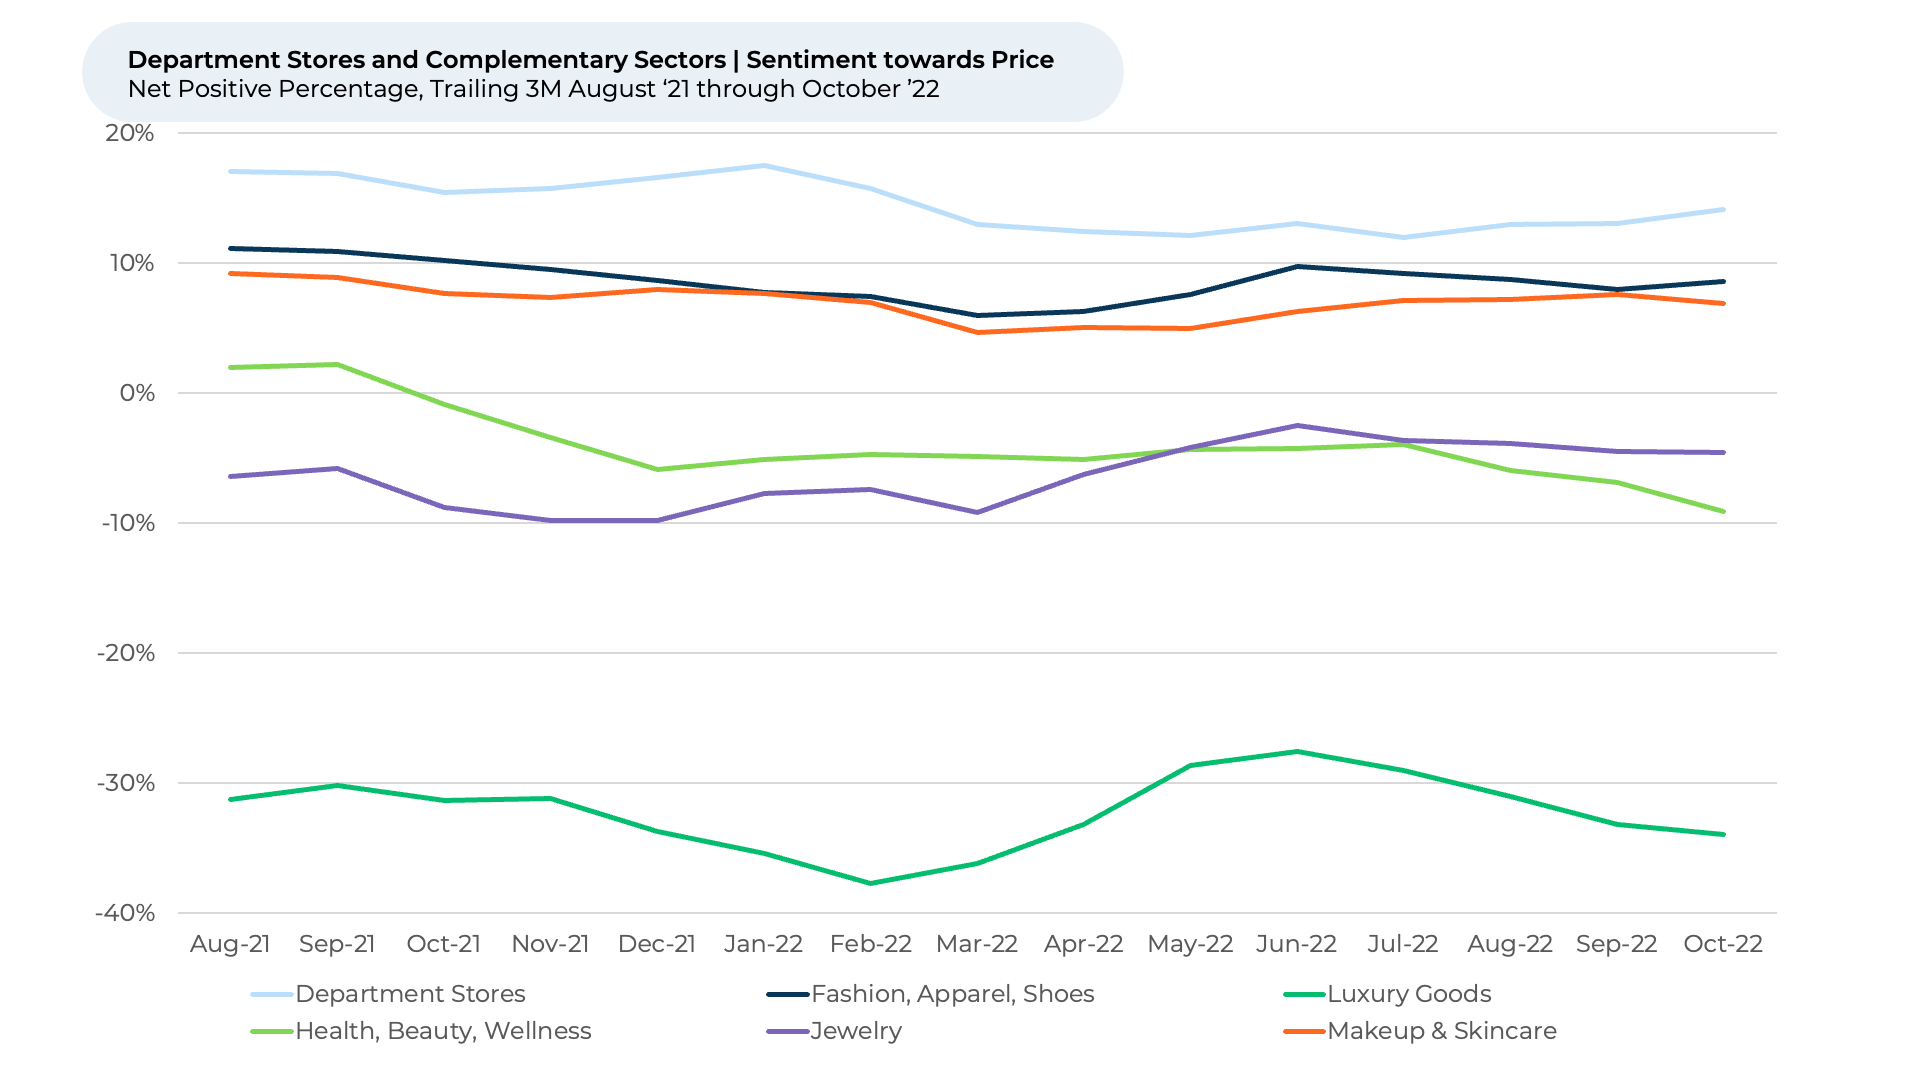
While Price sentiment remained largely stable with Department Stores and most complementary sectors since early 2022, Luxury Goods moved upward about ten percentage points - from T3M February 2022 to T3M June 2022 to -28% before pulling back to -34% for T3M October 2022. Jewelry saw similar, though less pronounced, movement.
We will continue to look for signs that the decline in both Price sentiment and NPI for the Luxury Goods sector may result in deceleration in growth rates for the biggest players through the holiday season into 2023. Despite inflation woes, Luxury Goods remained in high demand throughout the first half of 2022. LVMH Moët Hennessy Louis Vuitton (LVMH), the major French fashion corporation whose dozens of subsidiaries include Tiffany & Co., Christian Dior, Marc Jacobs, Sephora, and TAG Heuer, said sales increased by almost 30% in the first nine months of 2022 compared to the year before.
Selection
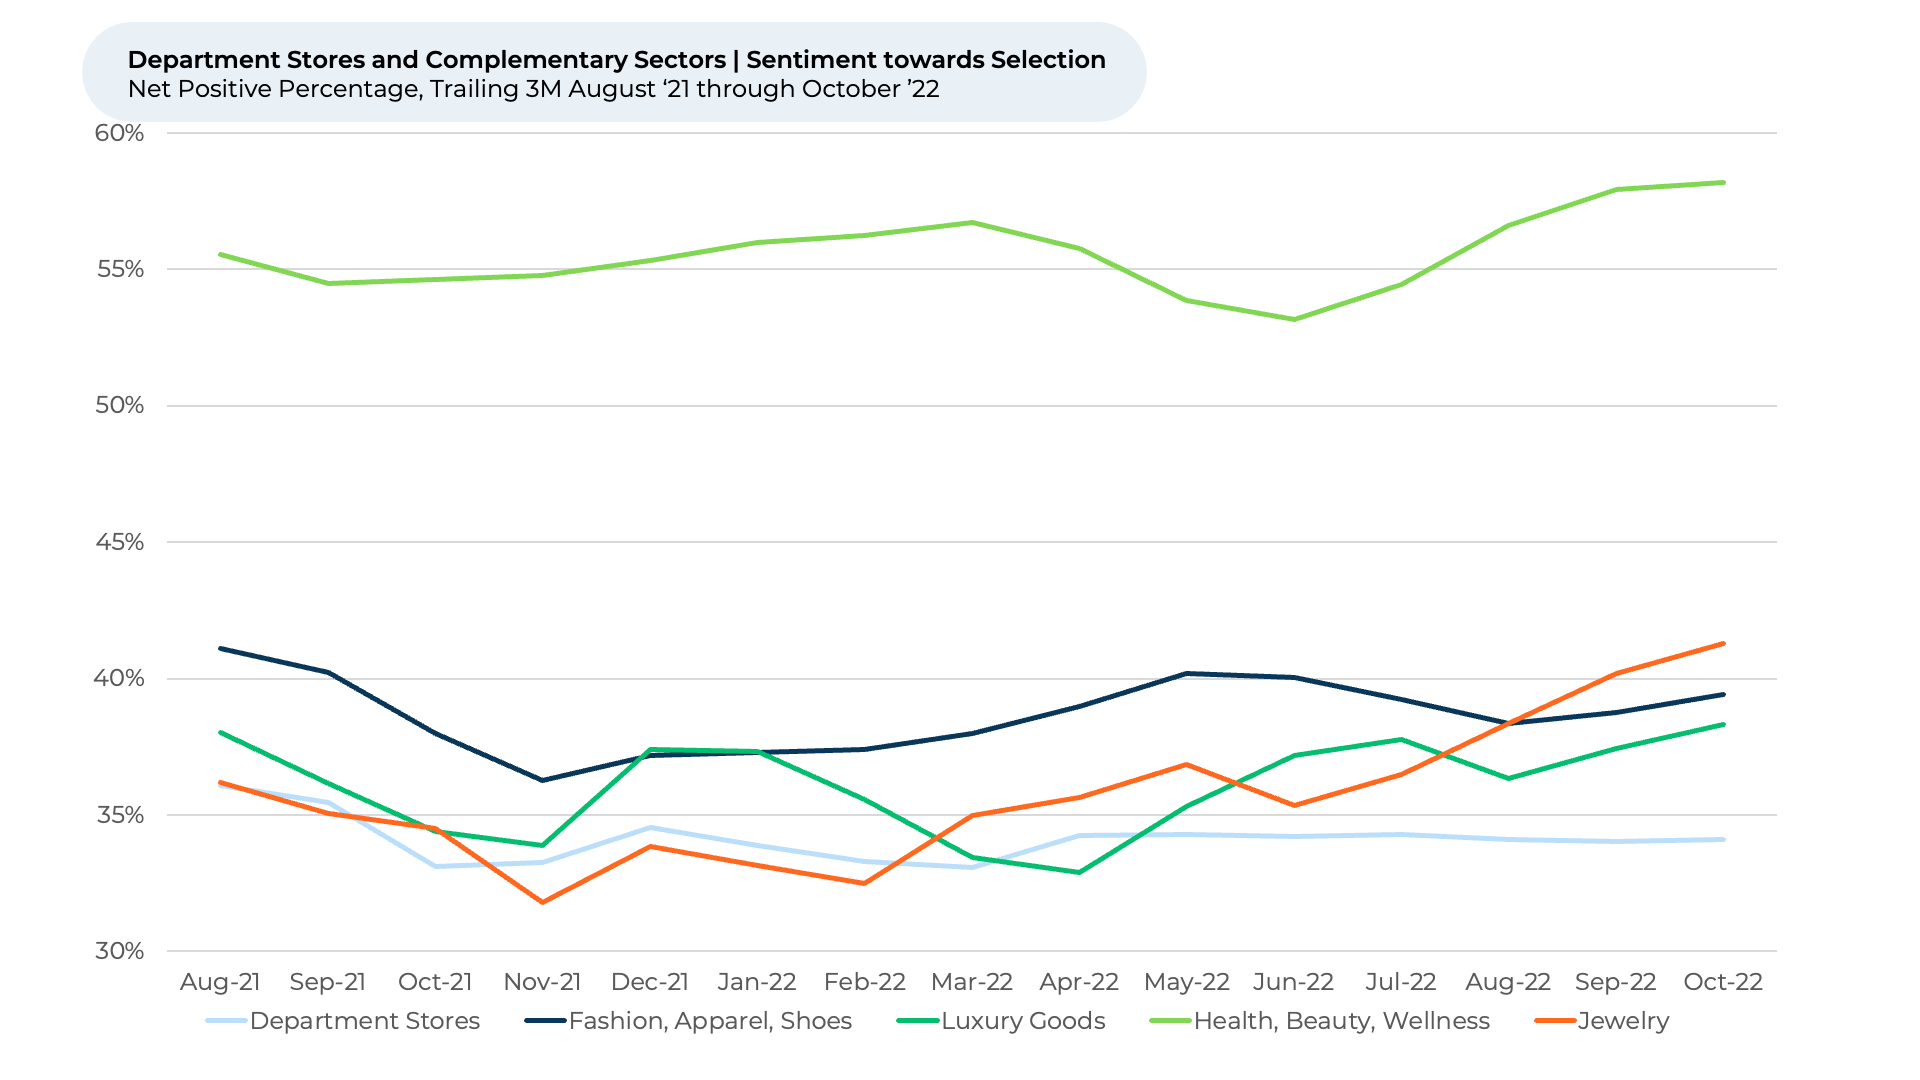
Amid global supply chain issues, apparel retailers struggle to keep their shelves stocked with clothing people want. Perhaps that is a reason we have seen sentiment towards Selection for Health, Beauty, and Wellness be so far above department stores, apparel, and jewelry sectors. The businesses that lead on Selection, including Ulta Beauty, Sephora, and GNC, do not have as many seasonal selections to maintain as do other Consumers’ sentiment on Selection within the Healthy, Beauty, and Wellness industry rose from an NPP of 53% in T3M June 2022 to one of 58% in T3M October.
Sephora, the beauty store chain owned by LVMH, helped drive the overall Health, Beauty, and Wellness sector upward on Selection NPP. The store, which sells more than 300 brands, moved from an NPP of 56% in T3M June 2022 to one of 61% in T3M October 2022.
One Sephora shopper told HundredX they are a “(b)ig fan and I’ve turned my kids into fans as well. Love the selection of brands and the knowledge of staff when you do have something you need.”
Jewelry similarly rose from 35% NPP in T3M June 2022 to 41% NPP in T3M October. We find most jewelry stores we track in the sector saw upward movements in Selection NPP starting in T3M June 2022 and continuing through T3M October.
“(Kay has) quality products a variety of selections and a nice cost,” one Kay Jewelers customer said to HundredX. Kay Jewelers saw sentiment towards Selection improve from 31% NPP T3M March 2022 to 41% T3M October.
Styles
Luxury brands steer the fashion industries when it comes to style, and their success is driven by consumer’s perception of how stylish and cool they are. This is evidenced by the 67% of the time Luxury Goods customers selected “Style” is a key driver of satisfaction for T3M October 2022 being above 56%-62% for the other sectors highlighted.
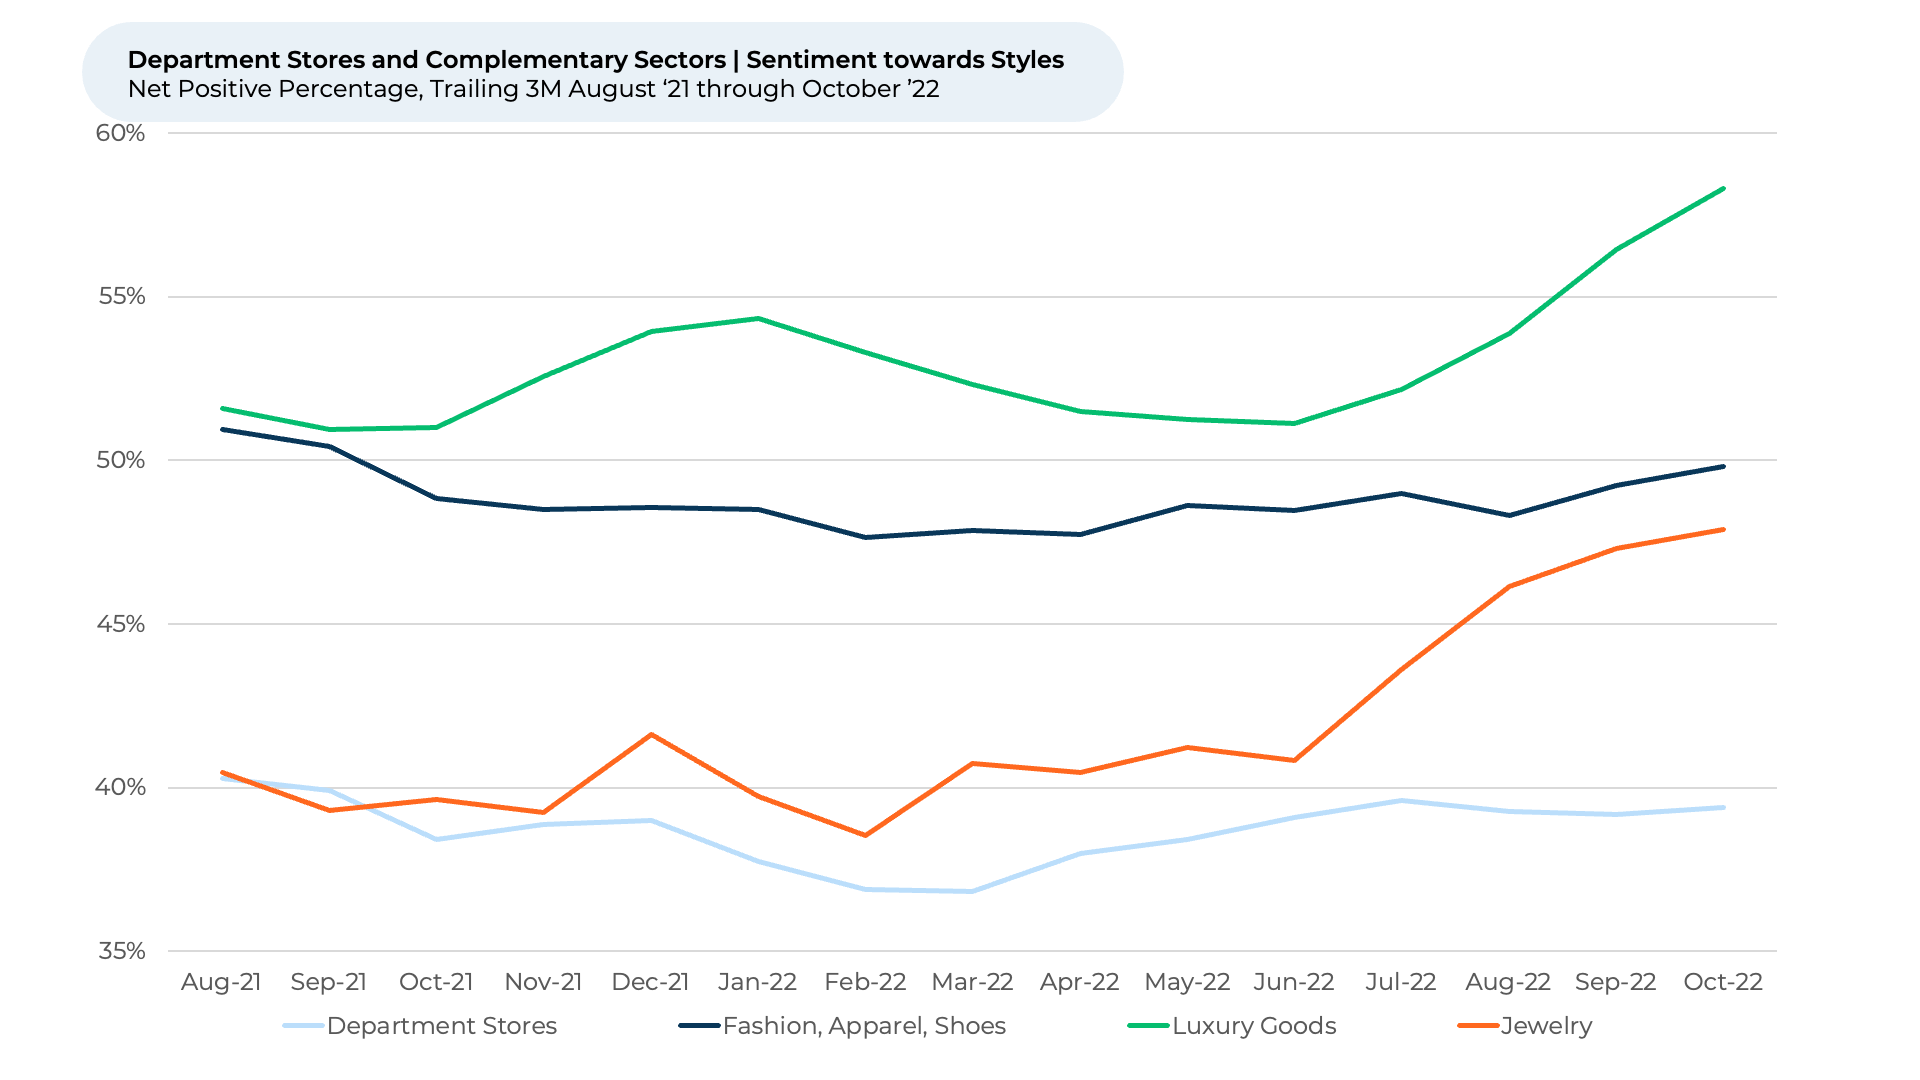
Luxury Goods and Jewelry moved upwards the most in Style NPP from T3M June 2022 to October. While all of the major jewelry brands HundredX tracks saw Style NPP increase, Kendra Scott, which operates more than 100 locations in the U.S., moved the most.
The company saw its Style NPP rise 10% from T3M June to T3M October 2022 to 63%, versus an average increase of 7% for others we cover.
“I feel like Kendra Scott has beautiful, trendy pieces that I enjoy looking at,” one shopper told HundredX. Another noted that the chain’s products are “affordable, fashionable, and durable.”
The upward trend in sentiment towards Style and Selection for Luxury Goods and Jewelry most likely explains why those sectors saw their customer satisfaction improve more than department stores over the past few months. We will continue to monitor segments to see if the improvement in satisfaction translates into a reversal of downward trends in NPI.
Look to future Crowd Reports™ to see how fundamentals for department stores and complementary industries evolve post COVID-19 lockdowns.
Strategy Made Smarter
HundredX works with a variety of companies and their investors to answer some of the most important strategy questions in business:
- Where are customers "migrating"?
- What are they saying they will use more of in the next 12 months?
- What are the key drivers of their purchase decisions and financial outcomes?
Current clients see immediate benefits across multiple areas including strategy, finance, operations, pricing, investing, and marketing.
Our insights enable business leaders to define and identify specific drivers and decisions enabling them to grow their market share.
Please contact our team to learn more about which businesses across 75 industries are best positioned with customers and the decisions you can make to grow your brand’s market share.
####
HundredX is a mission-based data and insights provider. HundredX does not make investment recommendations. However, we believe in the wisdom of the crowd to inform the outlook for businesses and industries. For more info on any of the sectors mentioned above, as well as any of our 75+ other industries, or if you'd like to understand more about using Data for Good, please reach out: https://hundredx.com/contact.
Share This Article