It's summer break for colleges, and young adults say they are planning to drink more.
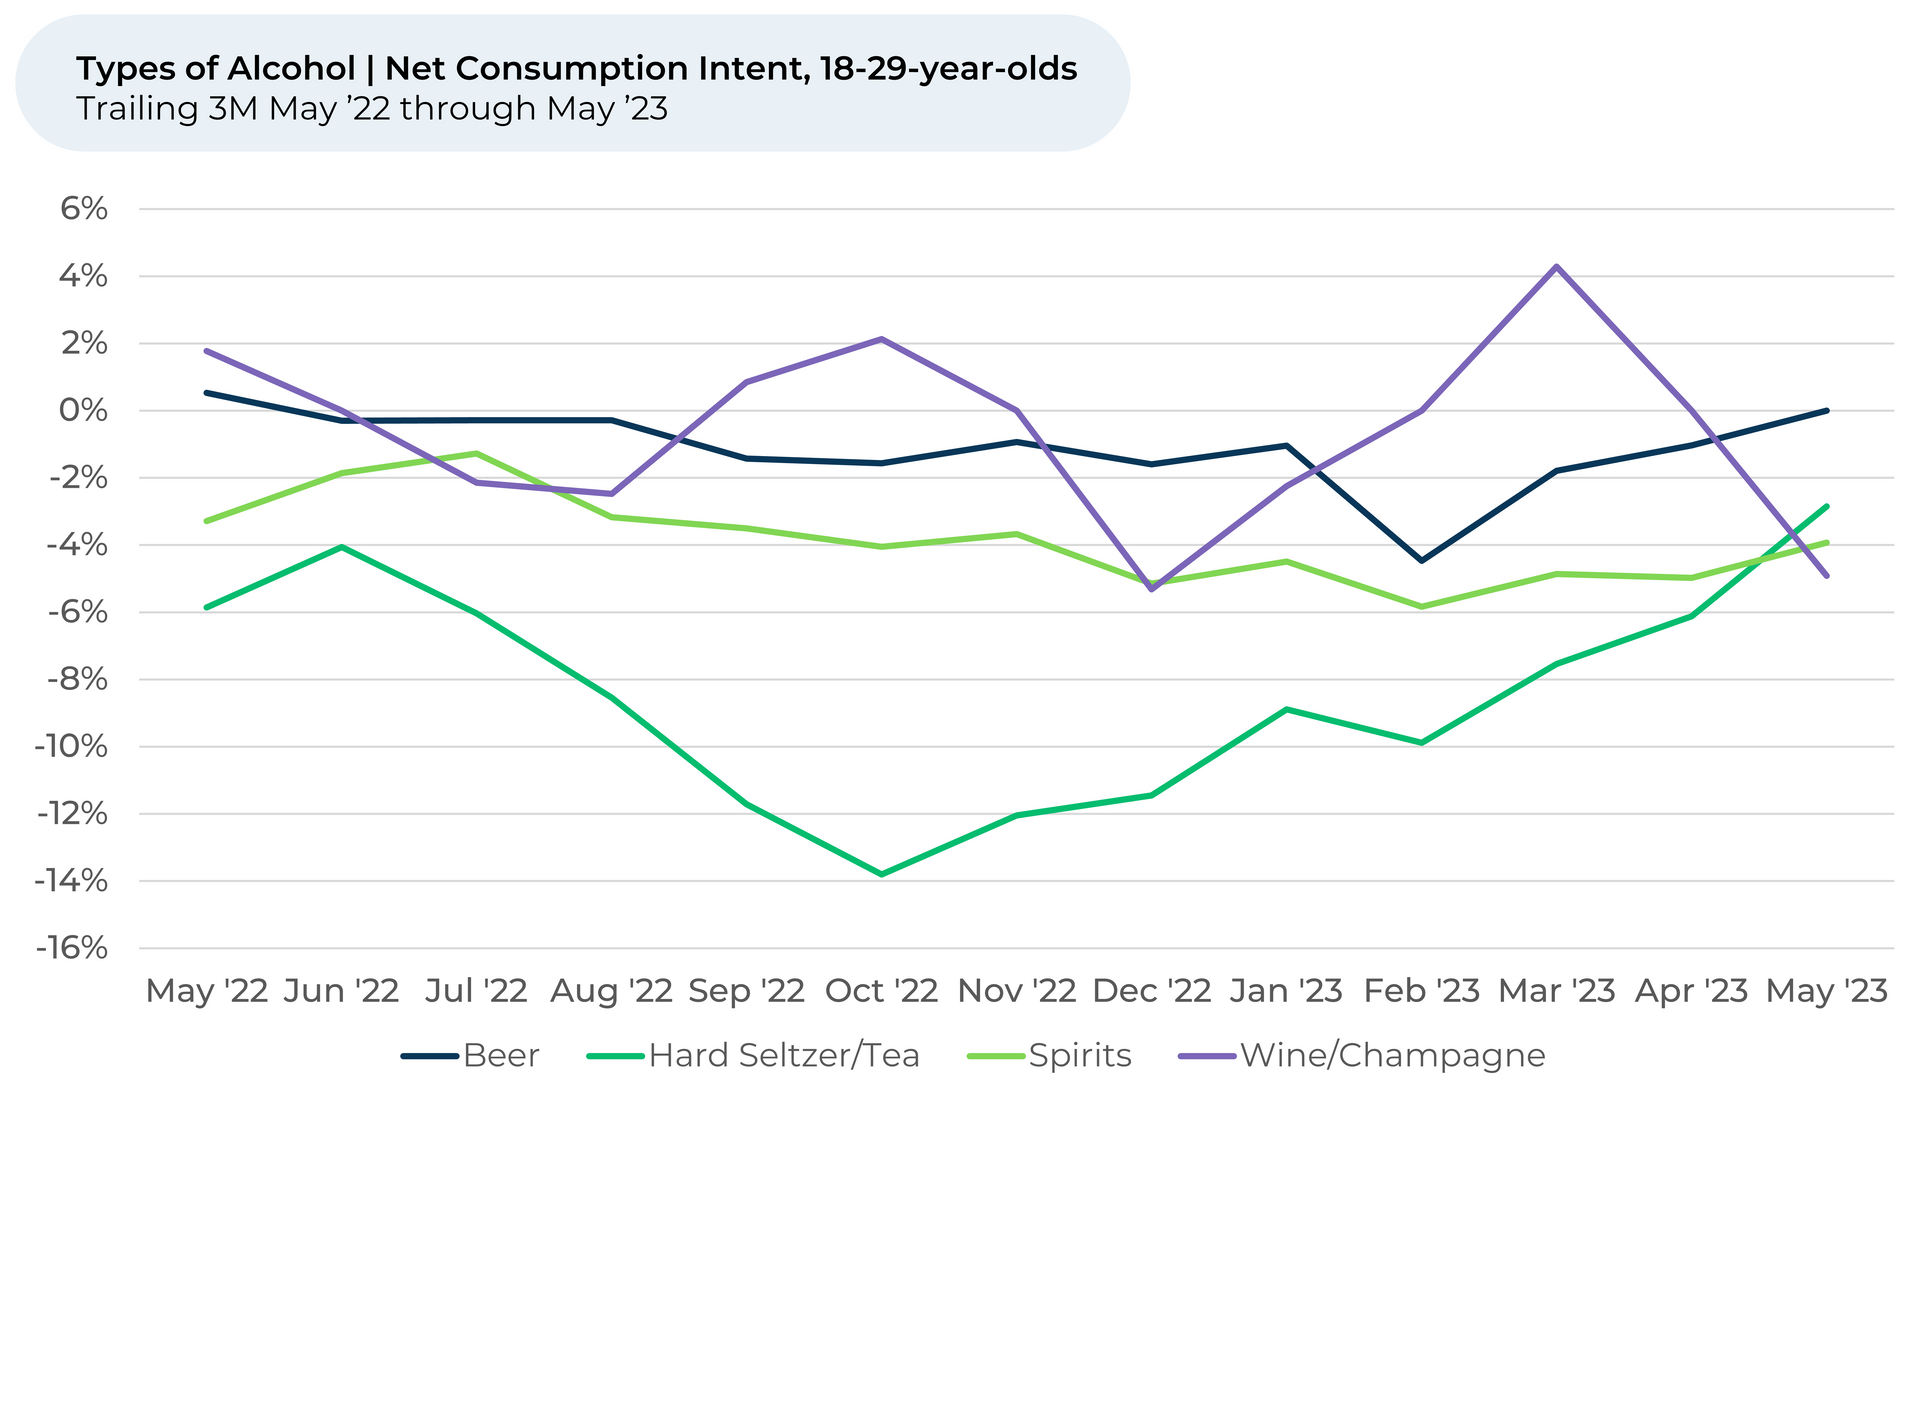
An analysis of more than 75,000 pieces of feedback from "The Crowd" of alcohol drinkers shows that, contrary to some media reports, 18-29-year-olds plan to drink more than older adults. Young adults seem particularly drawn to lower-calorie, lower-proof hard seltzers, juices, and teas, which have historically performed well in summer.
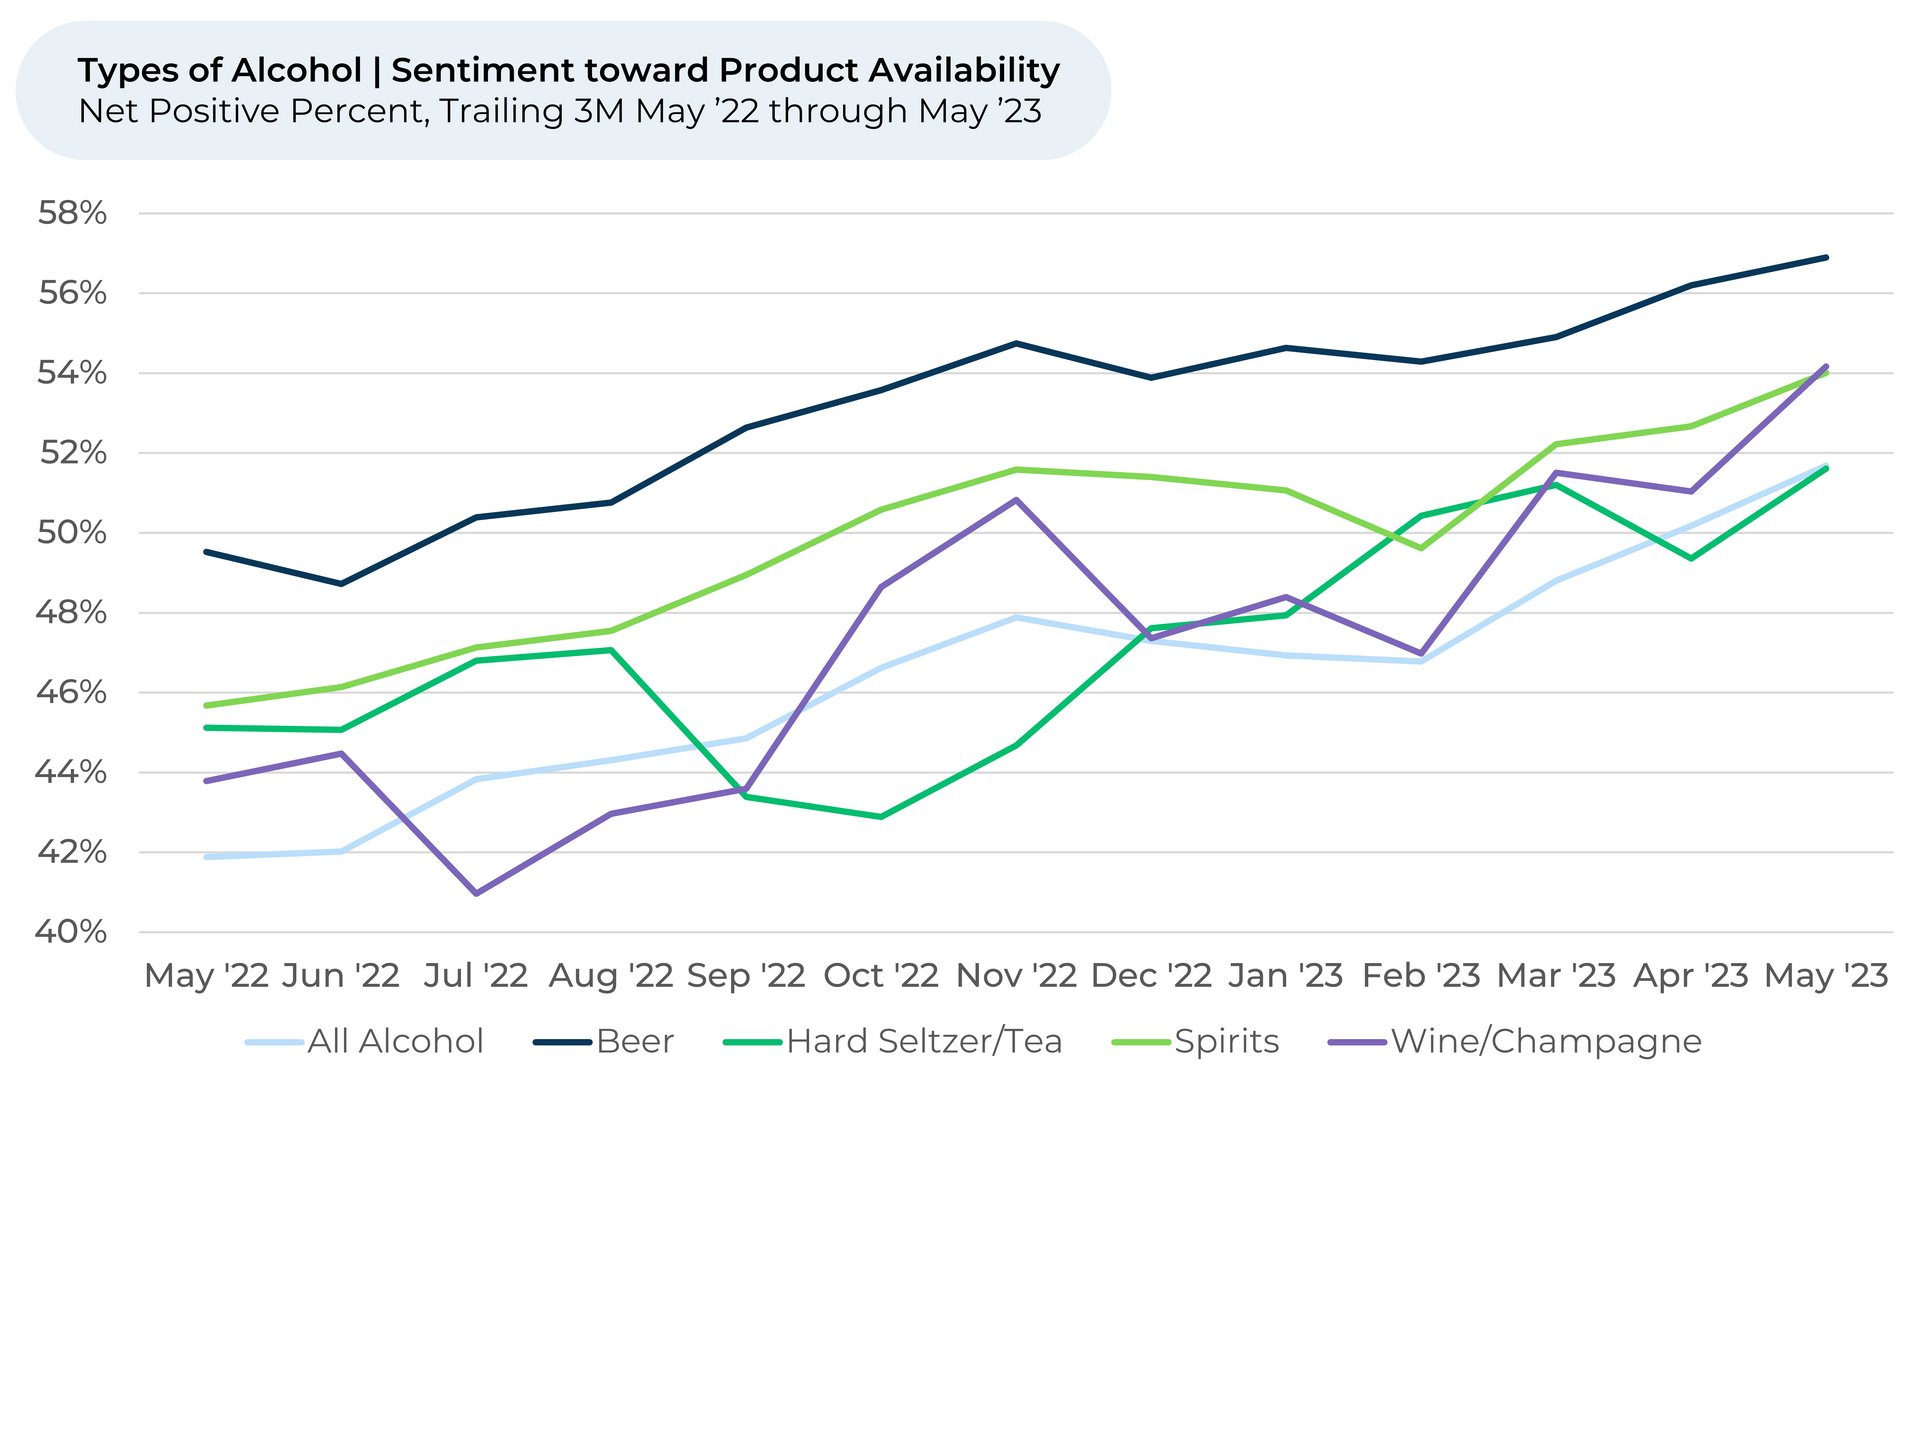
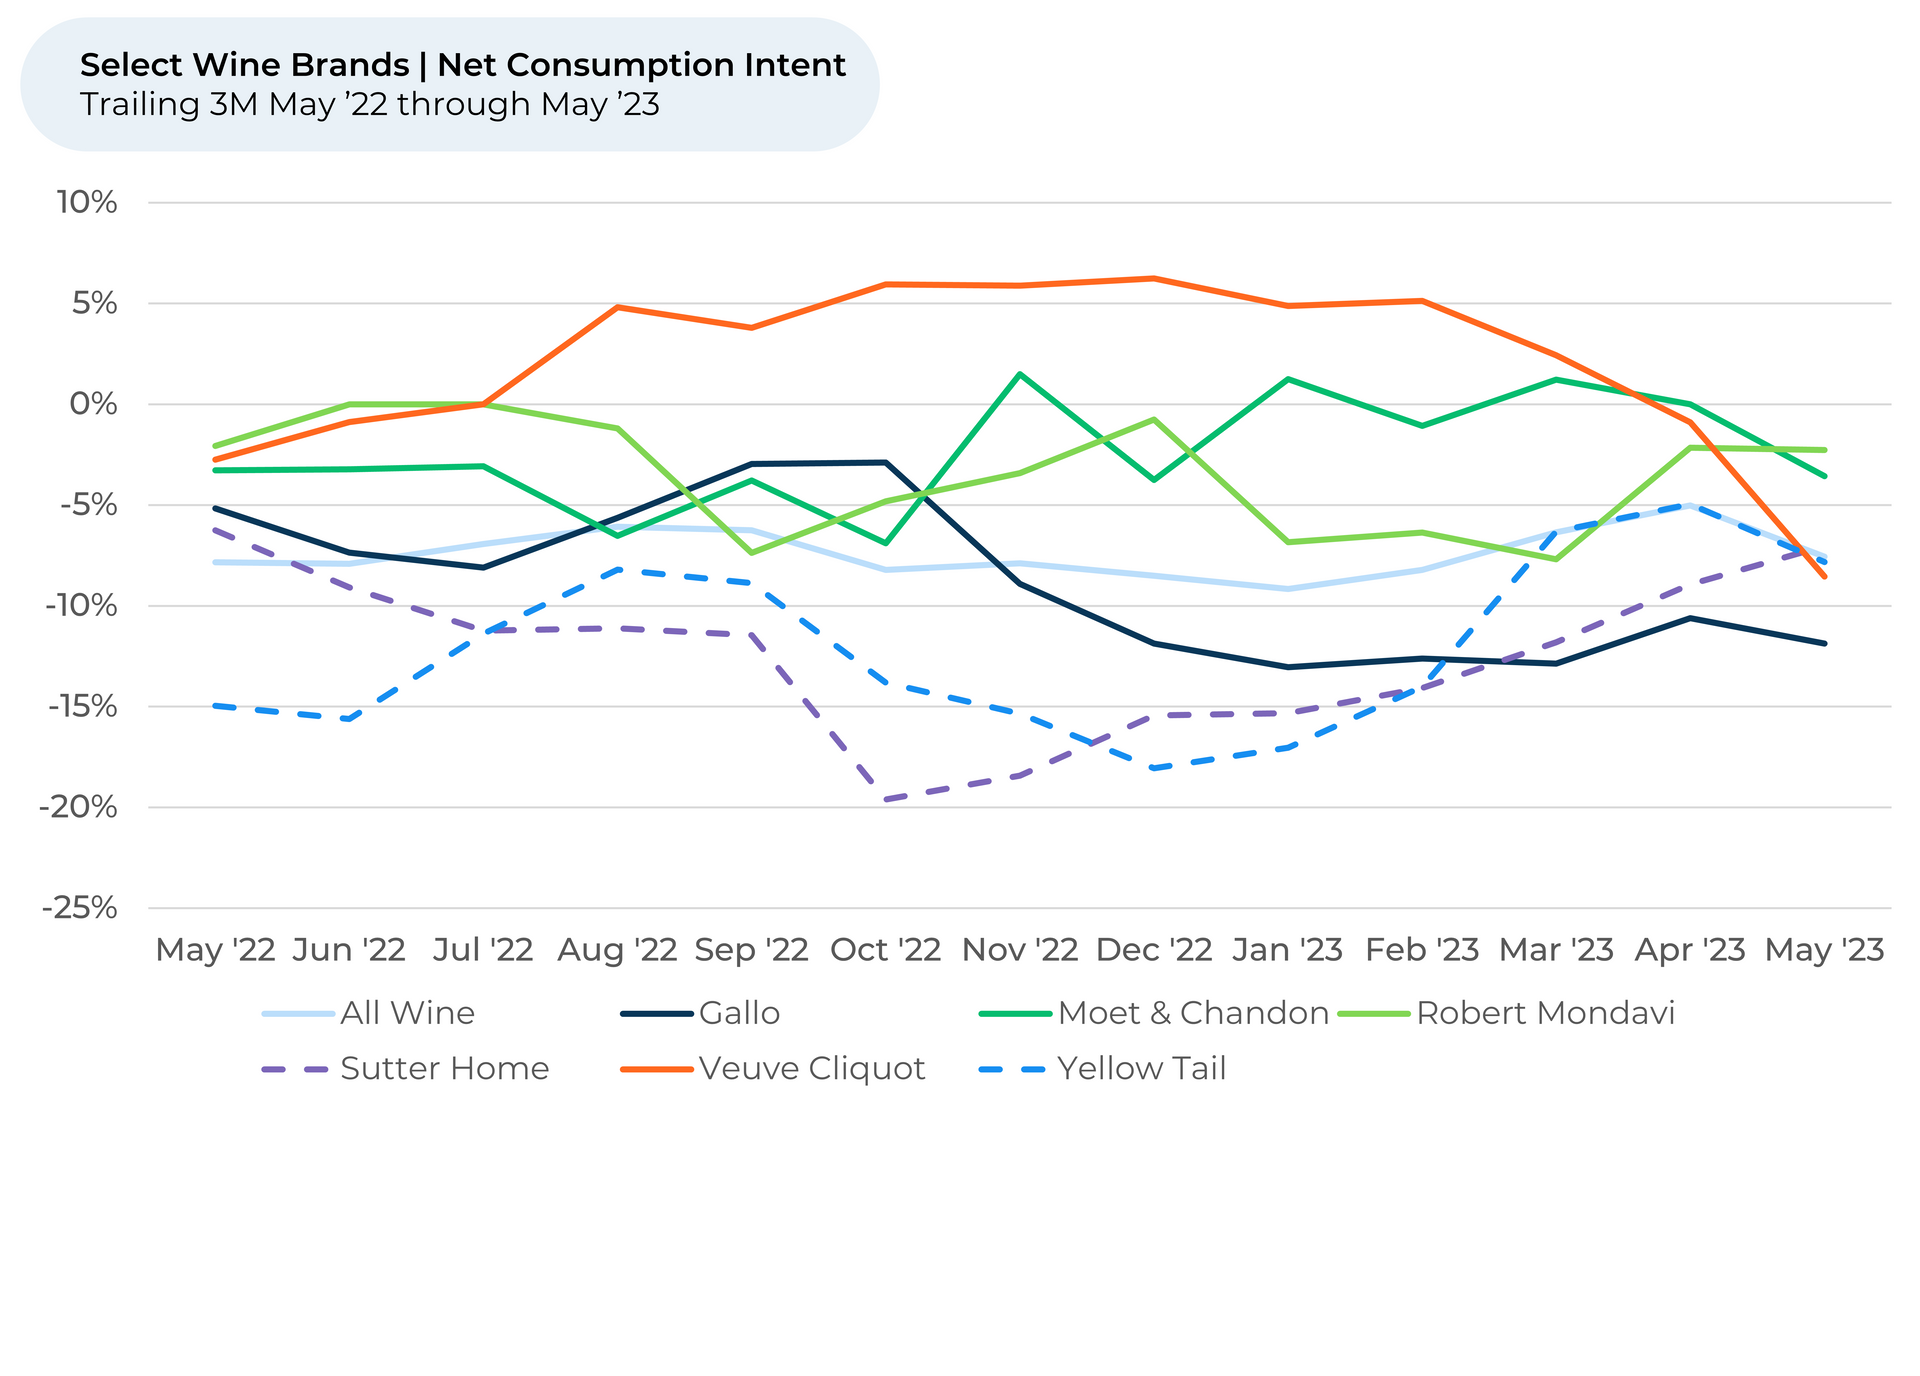
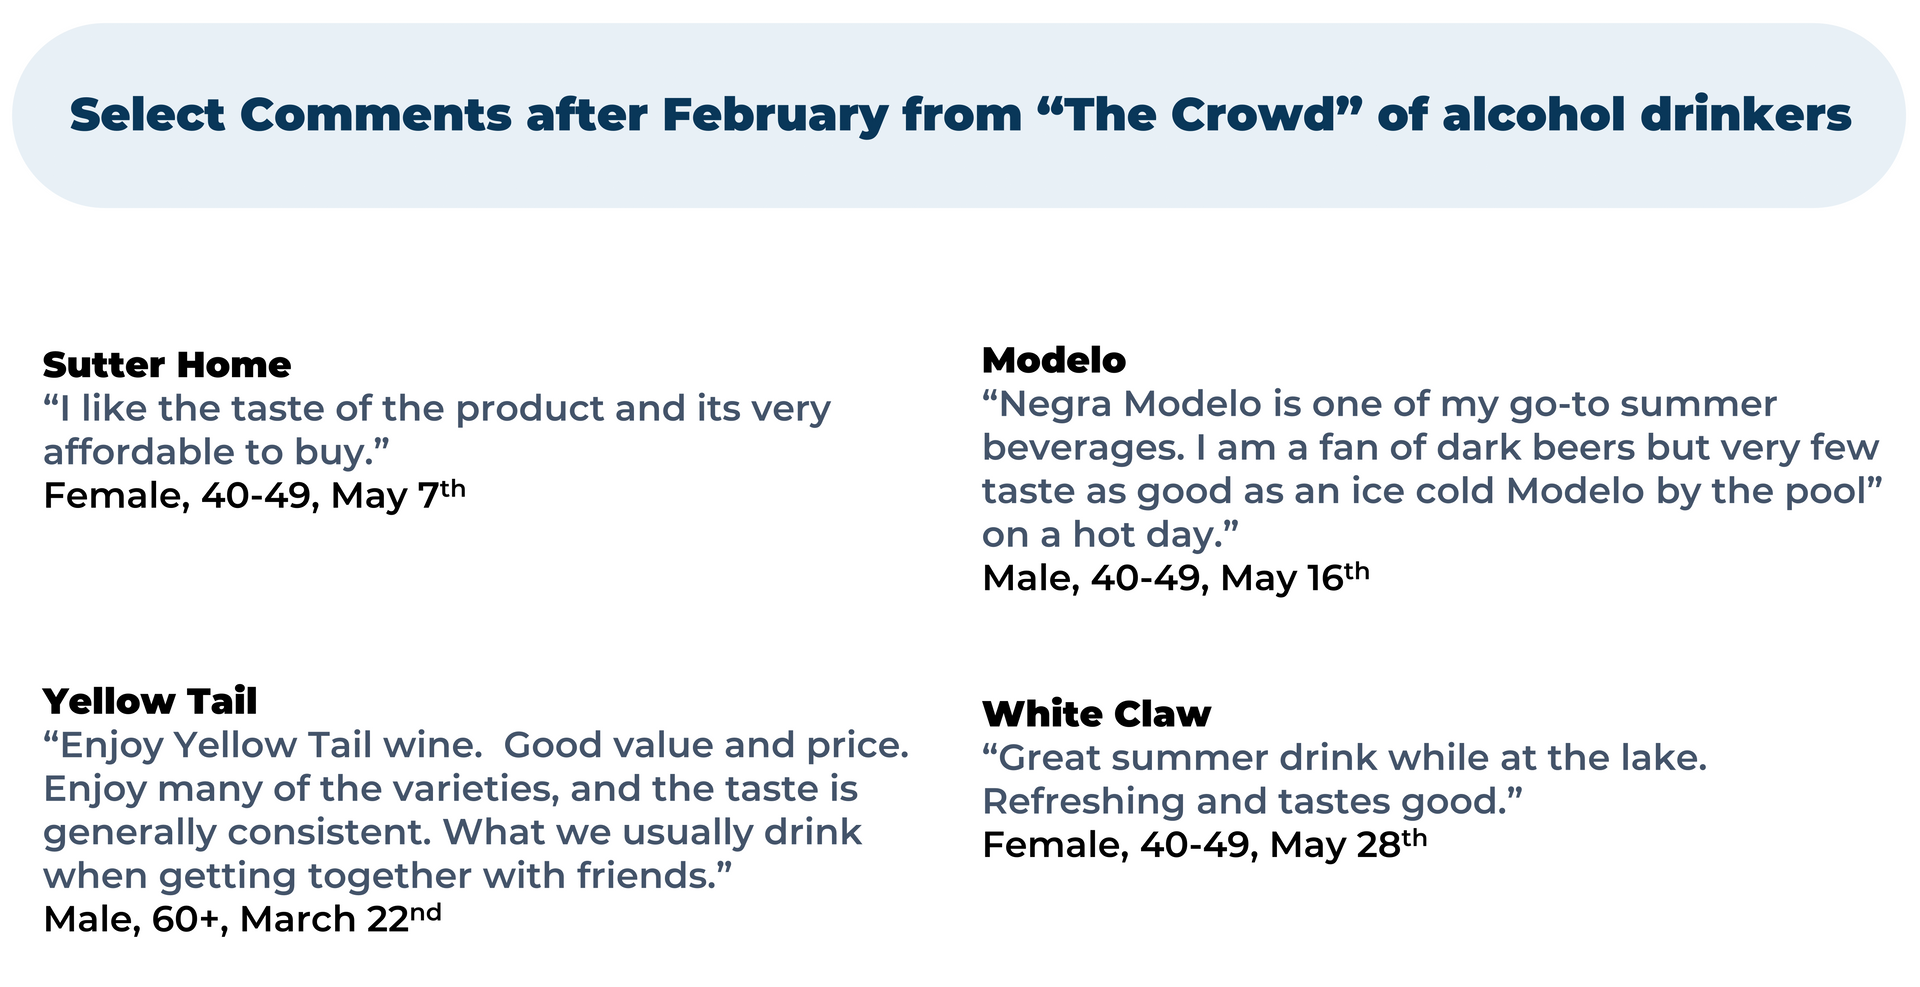
Adults of all ages, actually, are turning more toward wine, hard seltzers, and hard teas. As the weather warms up, customers increasingly like these types of drinks' taste and flavor options and the low costs of wine brands like Sutter Home and Yellow Tail. Take a look below at how HundredX customer data powers insights into the alcohol industry.
Key Takeaways:
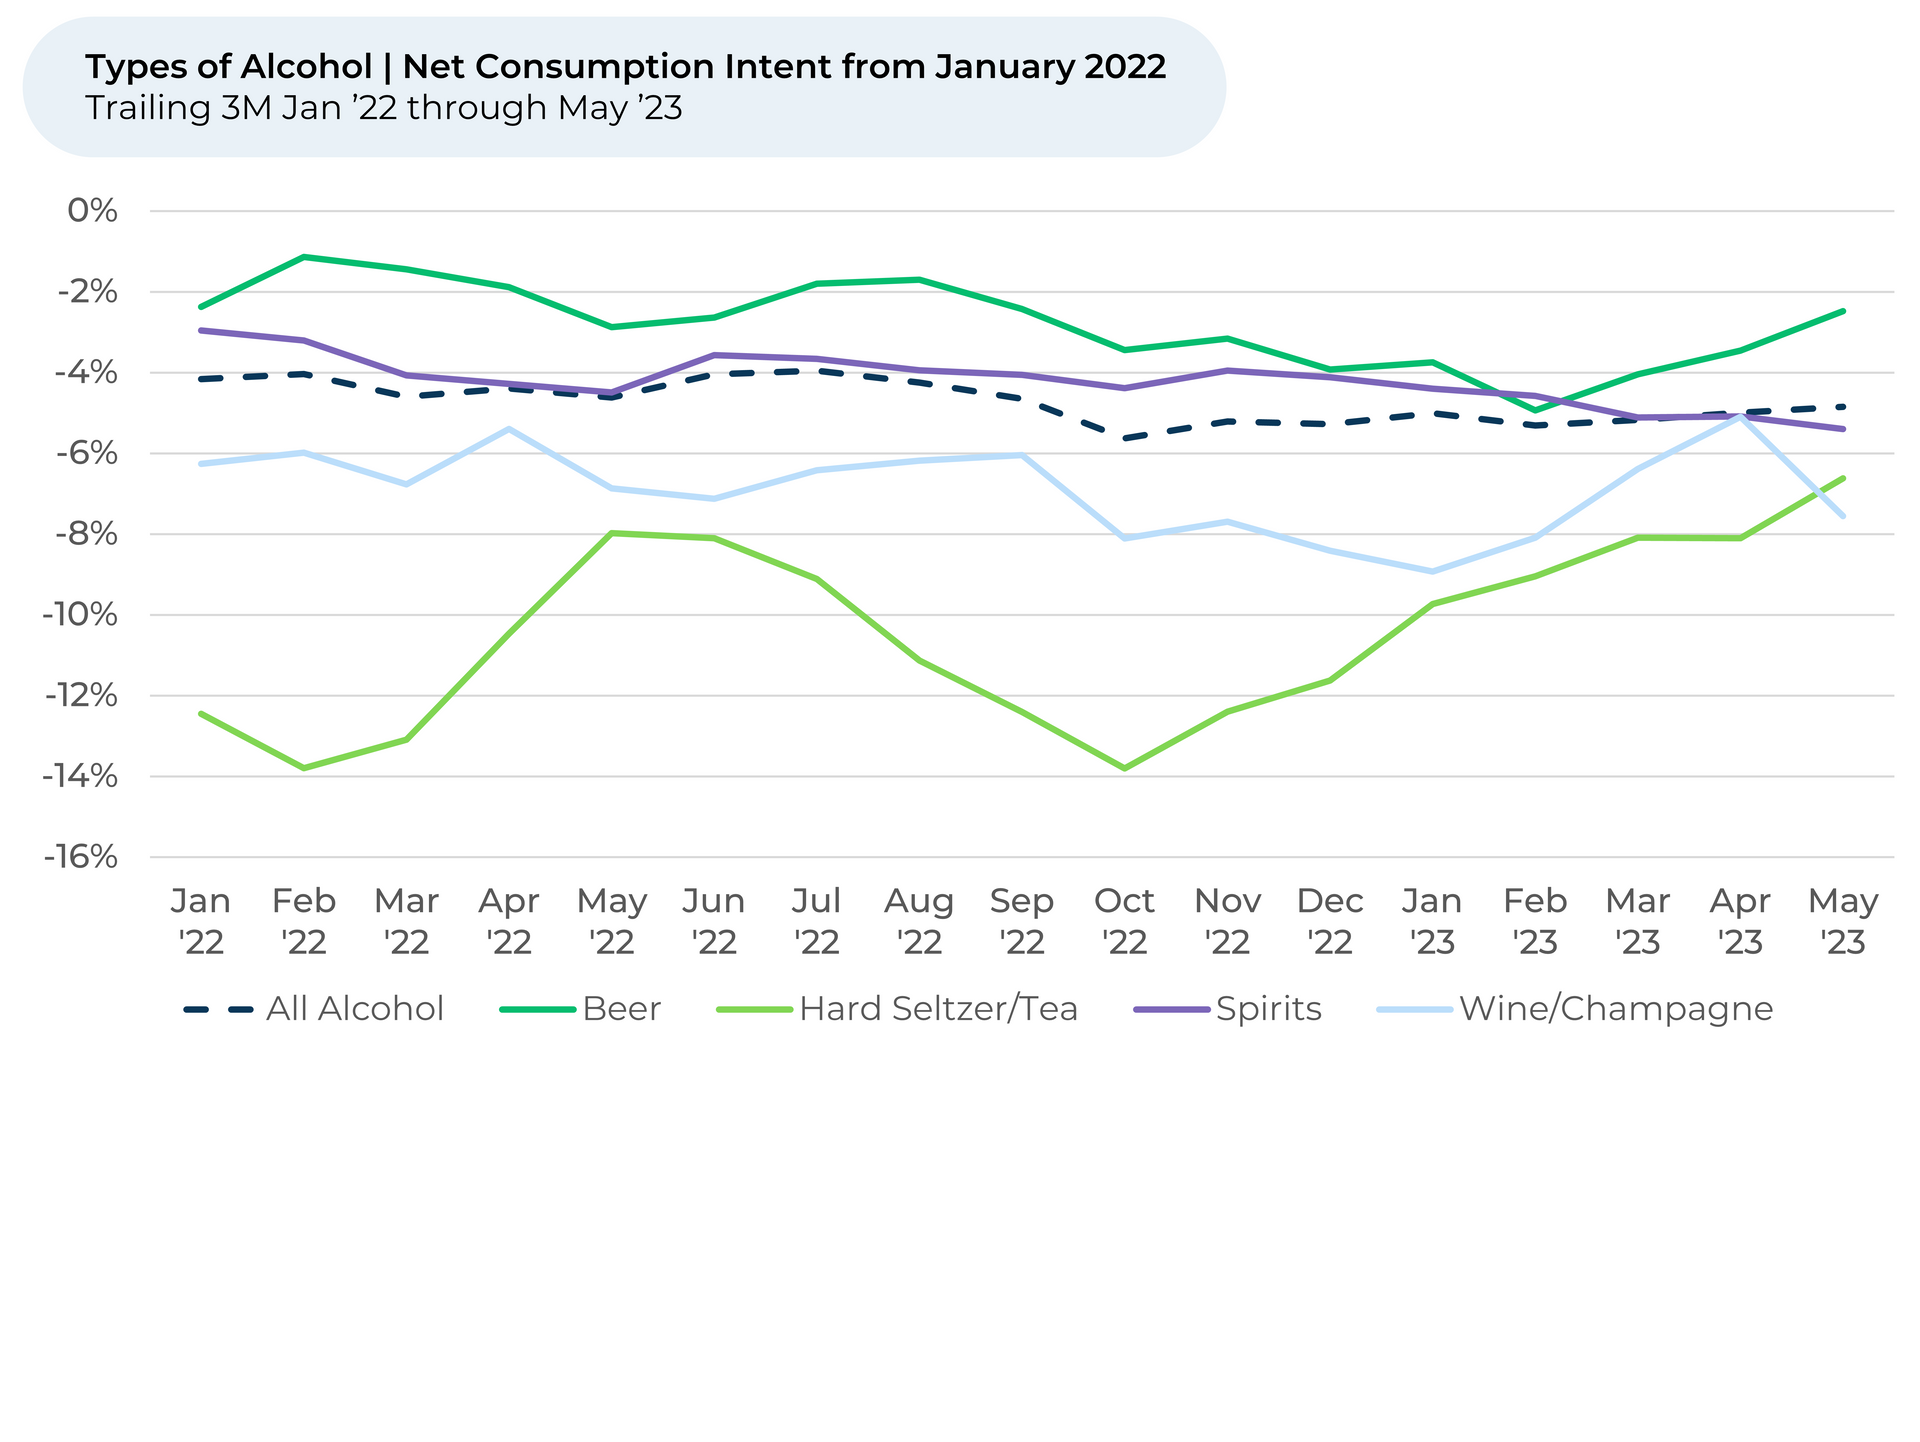
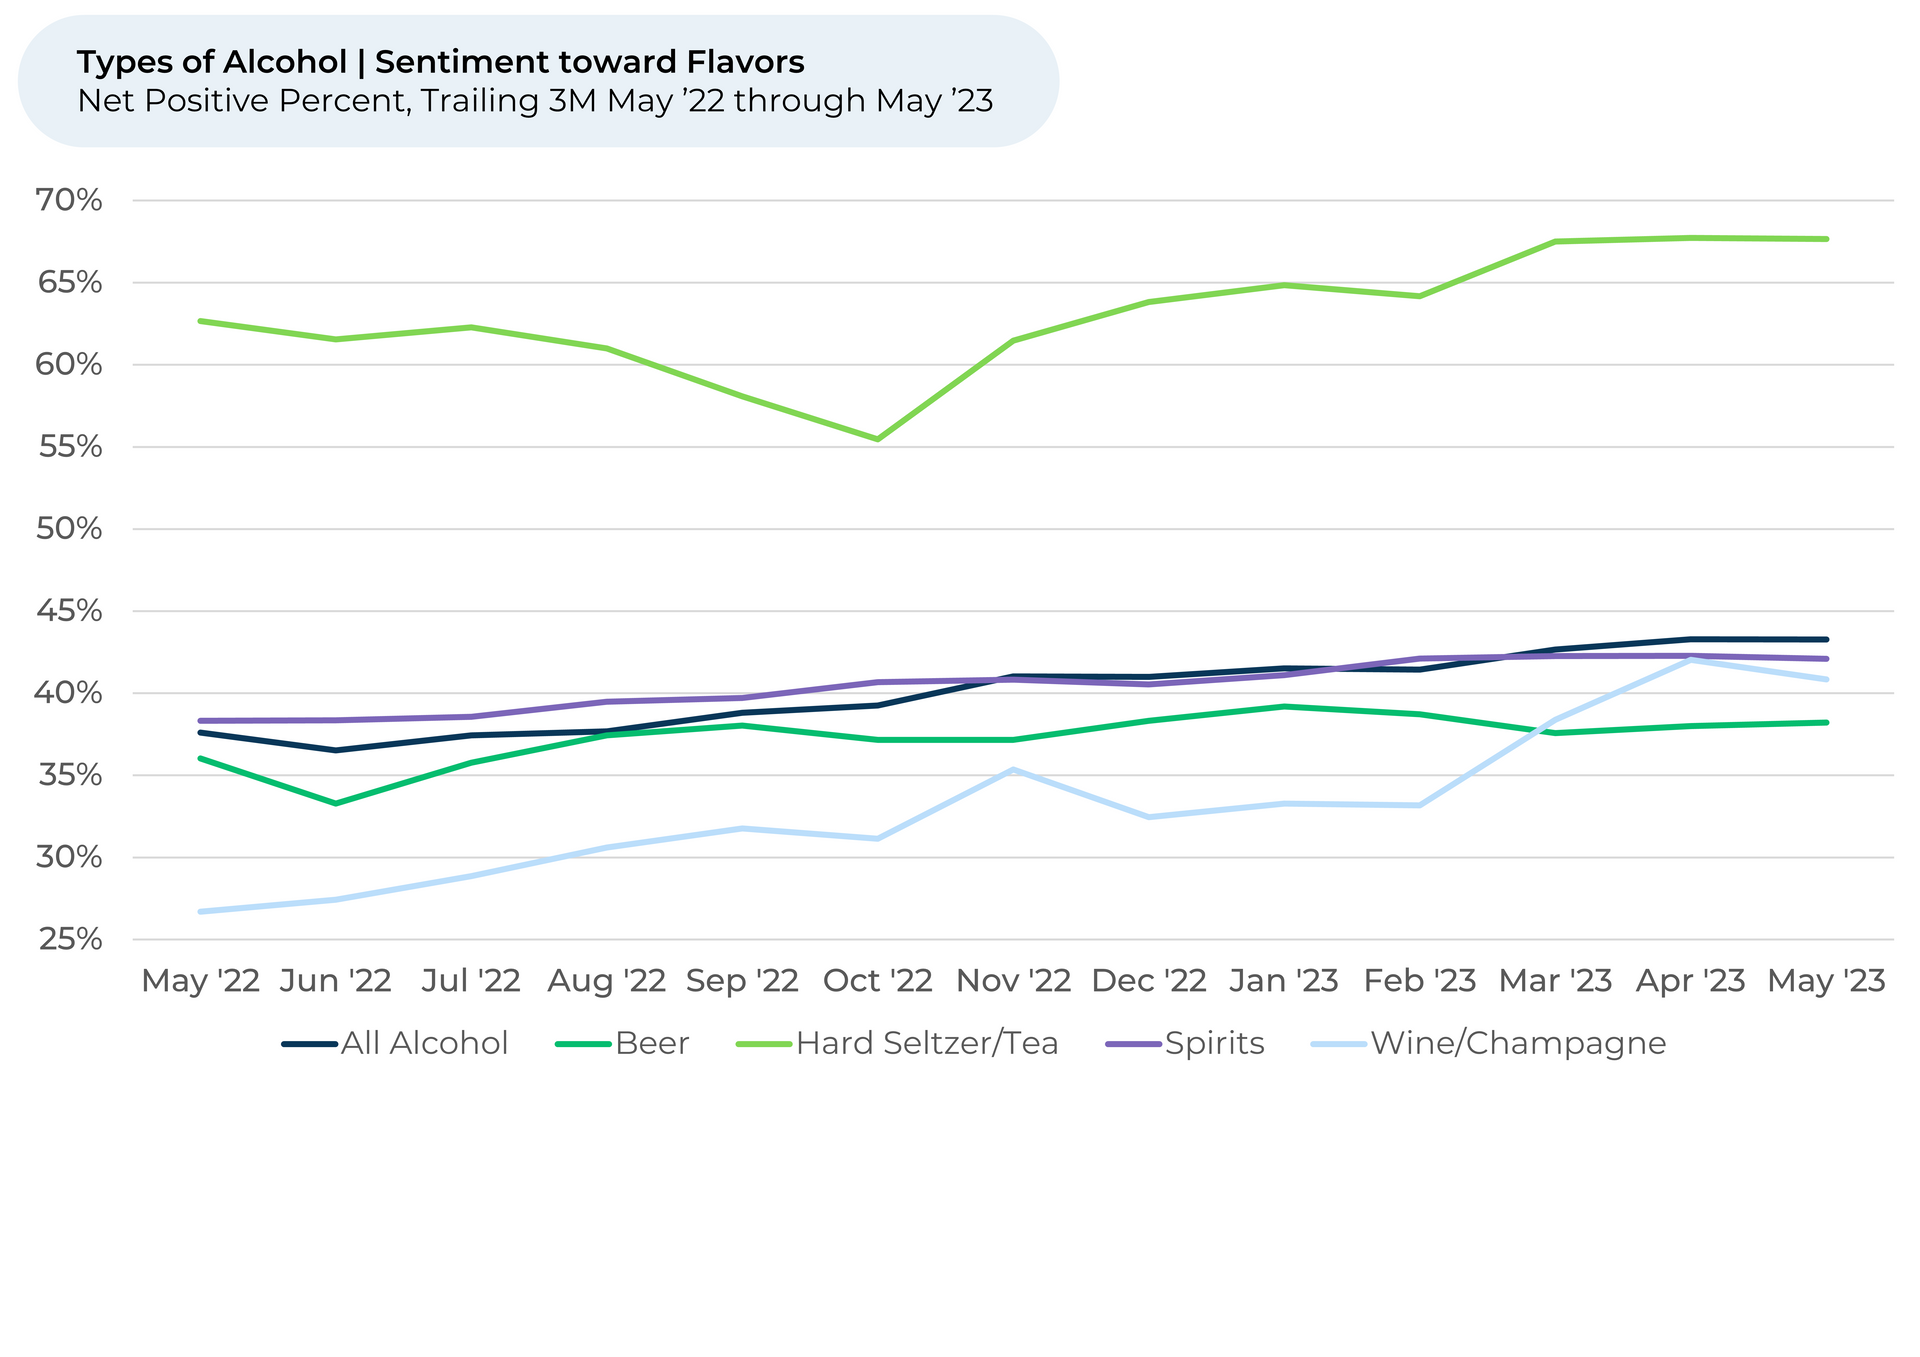
- Over the past three months, Consumption Intent1,2 rose for every type of alcohol except for spirits. Hard seltzer/tea, which is up the most over the past three months, exhibits some seasonality and is gaining interest with young adults.
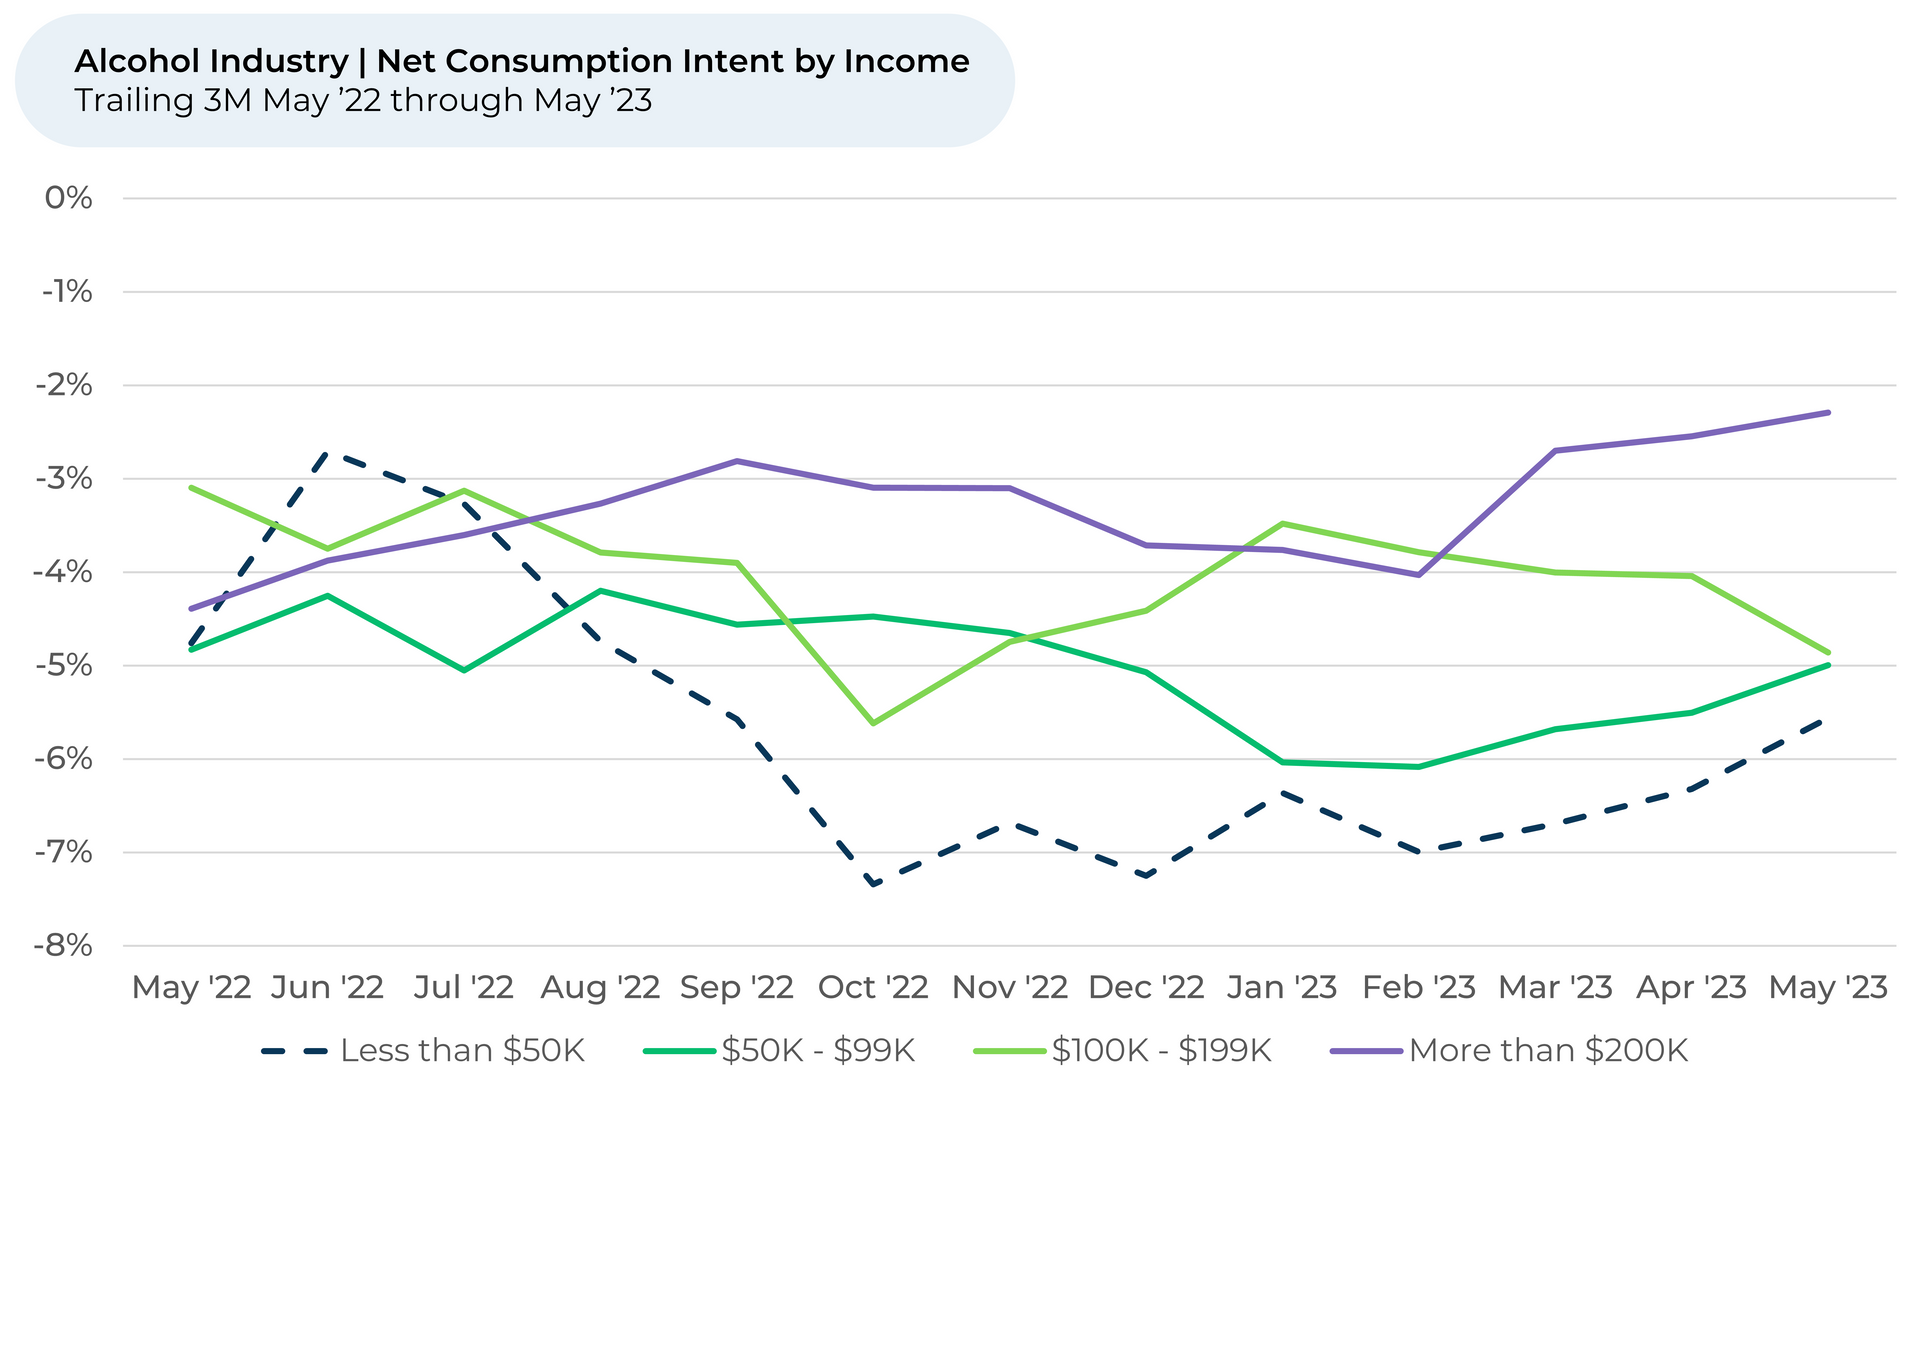
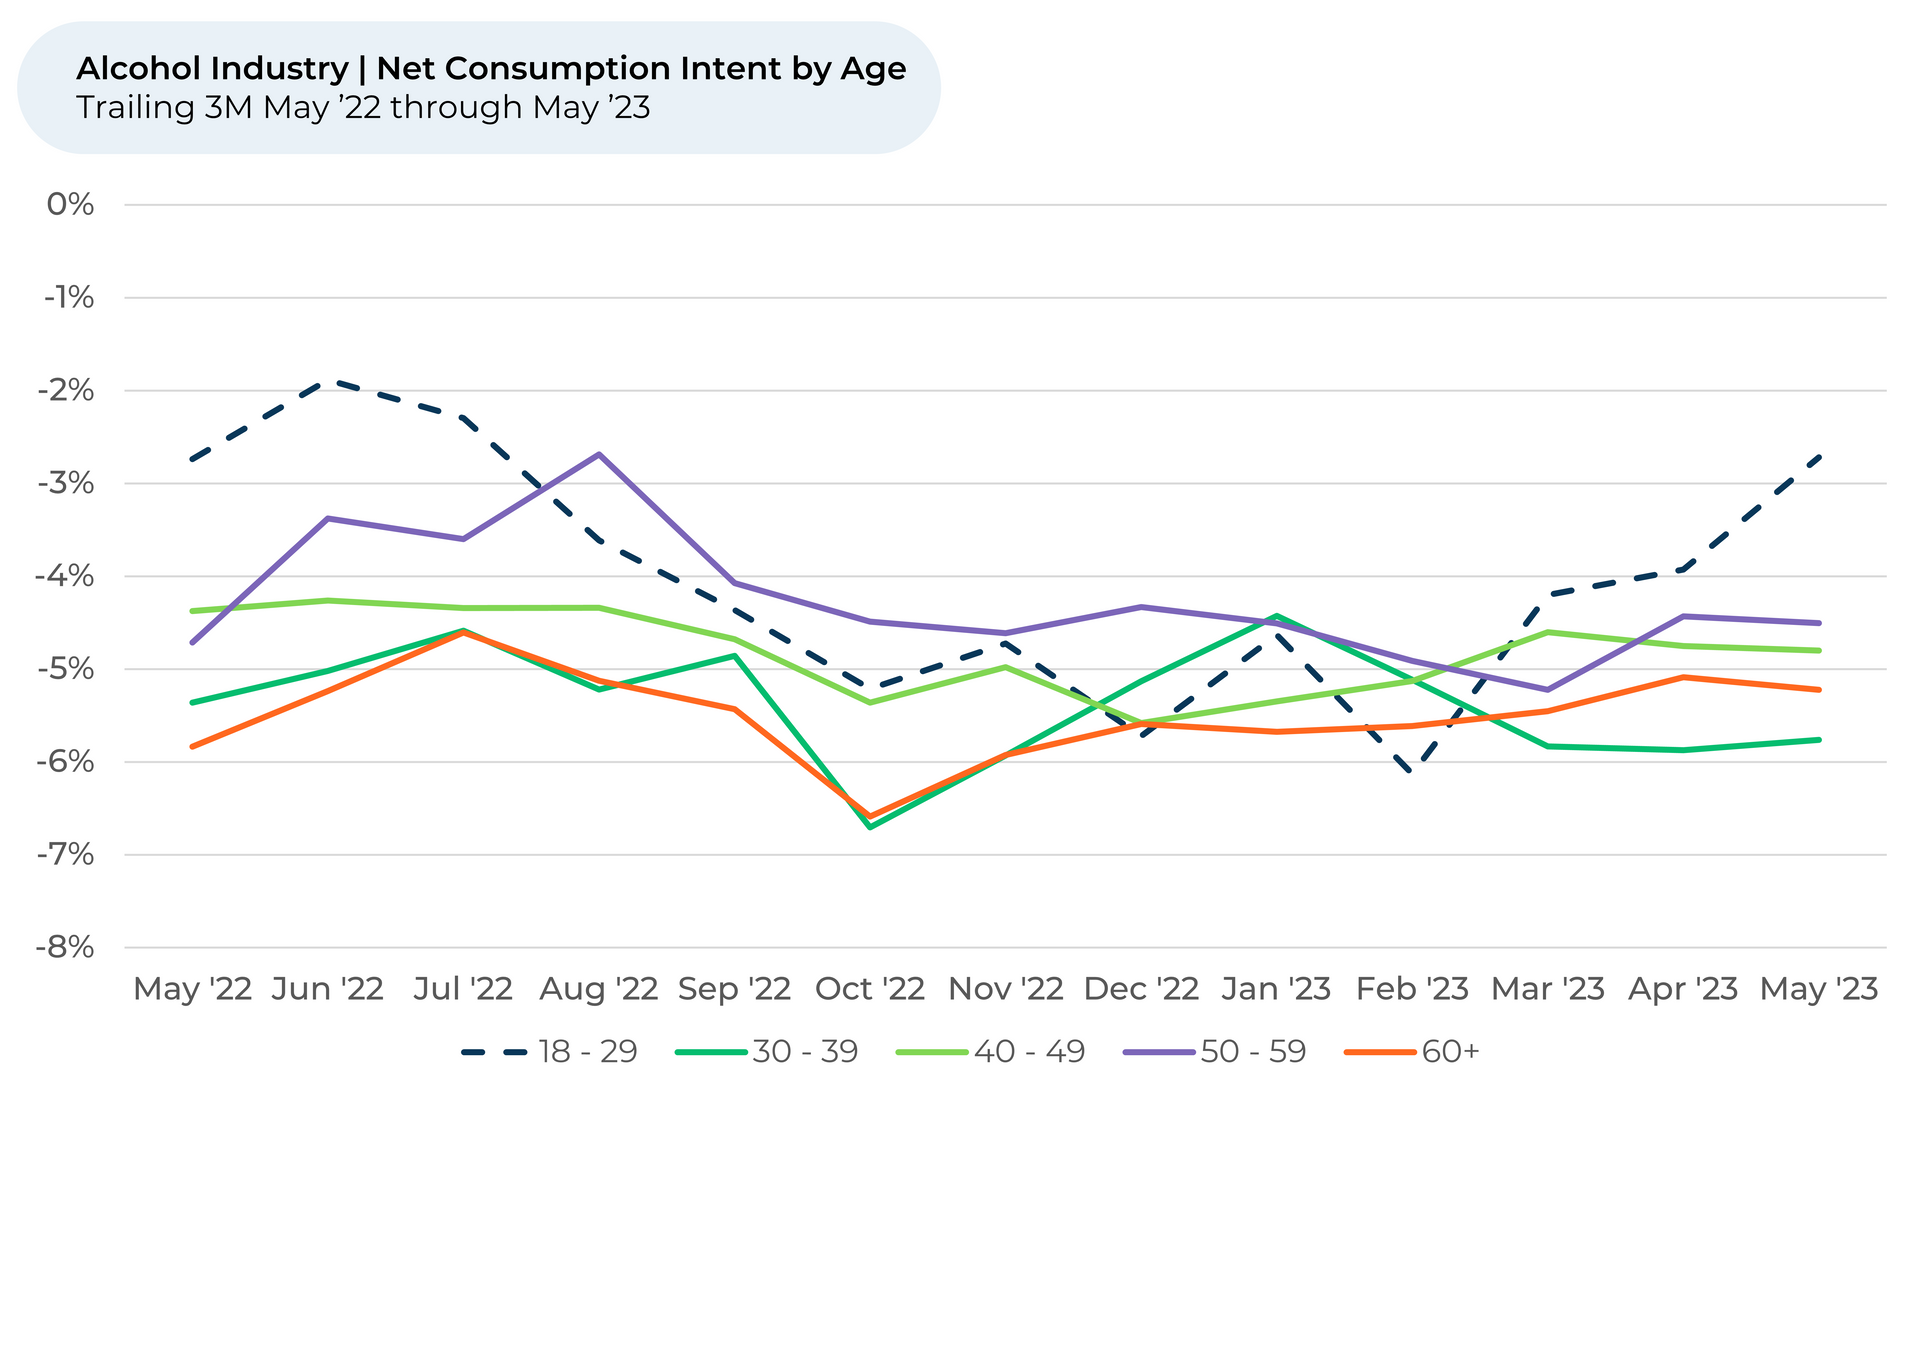
- Since February, Consumption Intent for all alcohol only increased for 18-29-year-olds; it stayed stable or fell for other age groups. This contrasts with some media reports claiming young adults are drinking less.
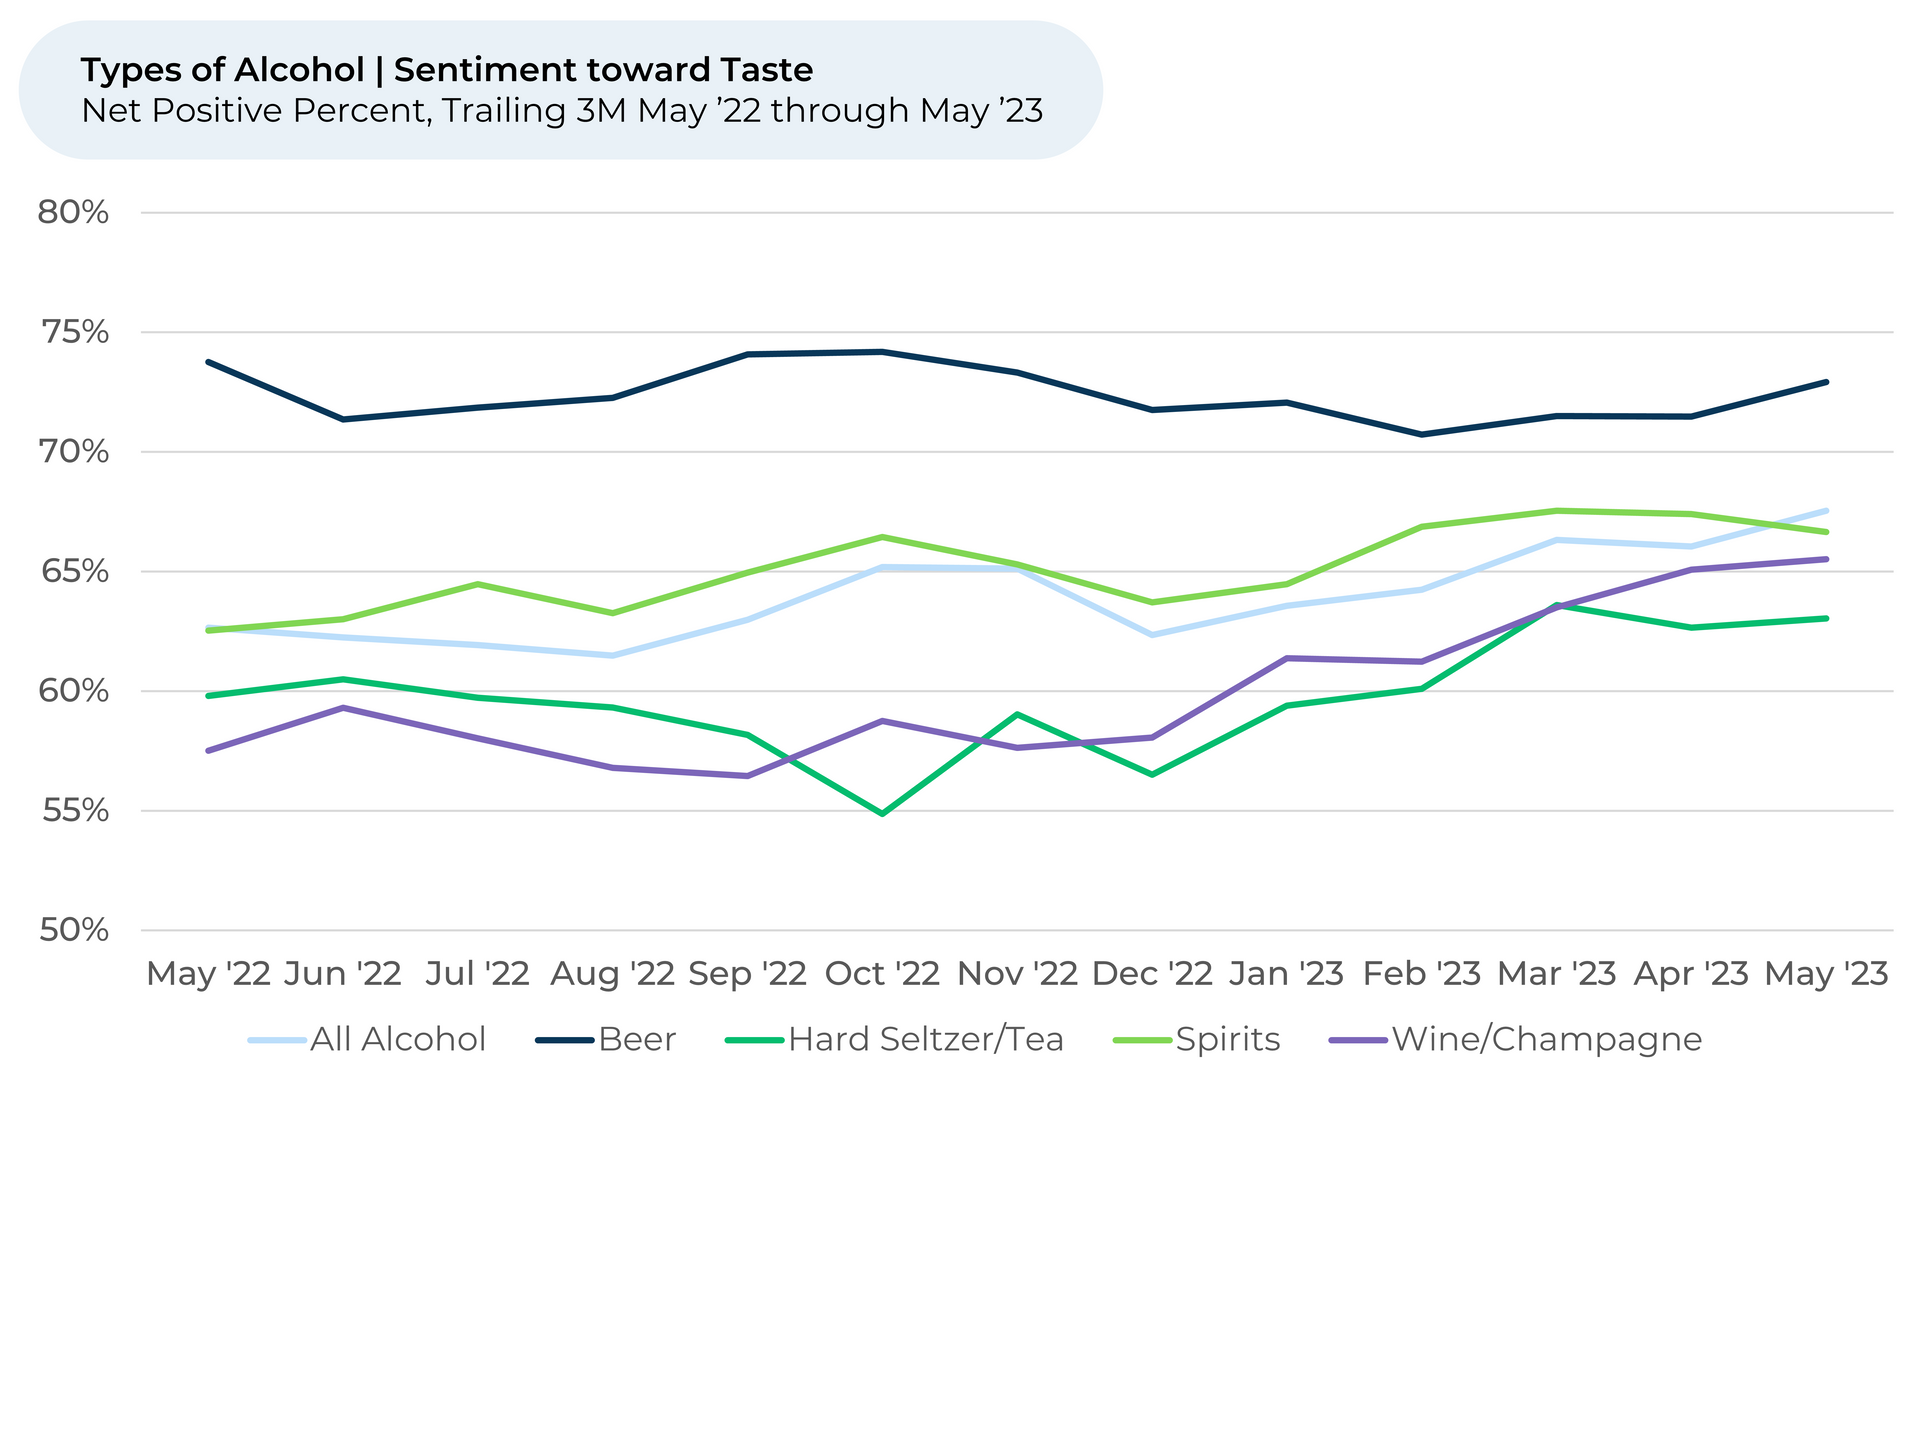
- Since February, sentiment3 toward Taste increased the most for wine/champagne, followed by hard seltzer/tea.
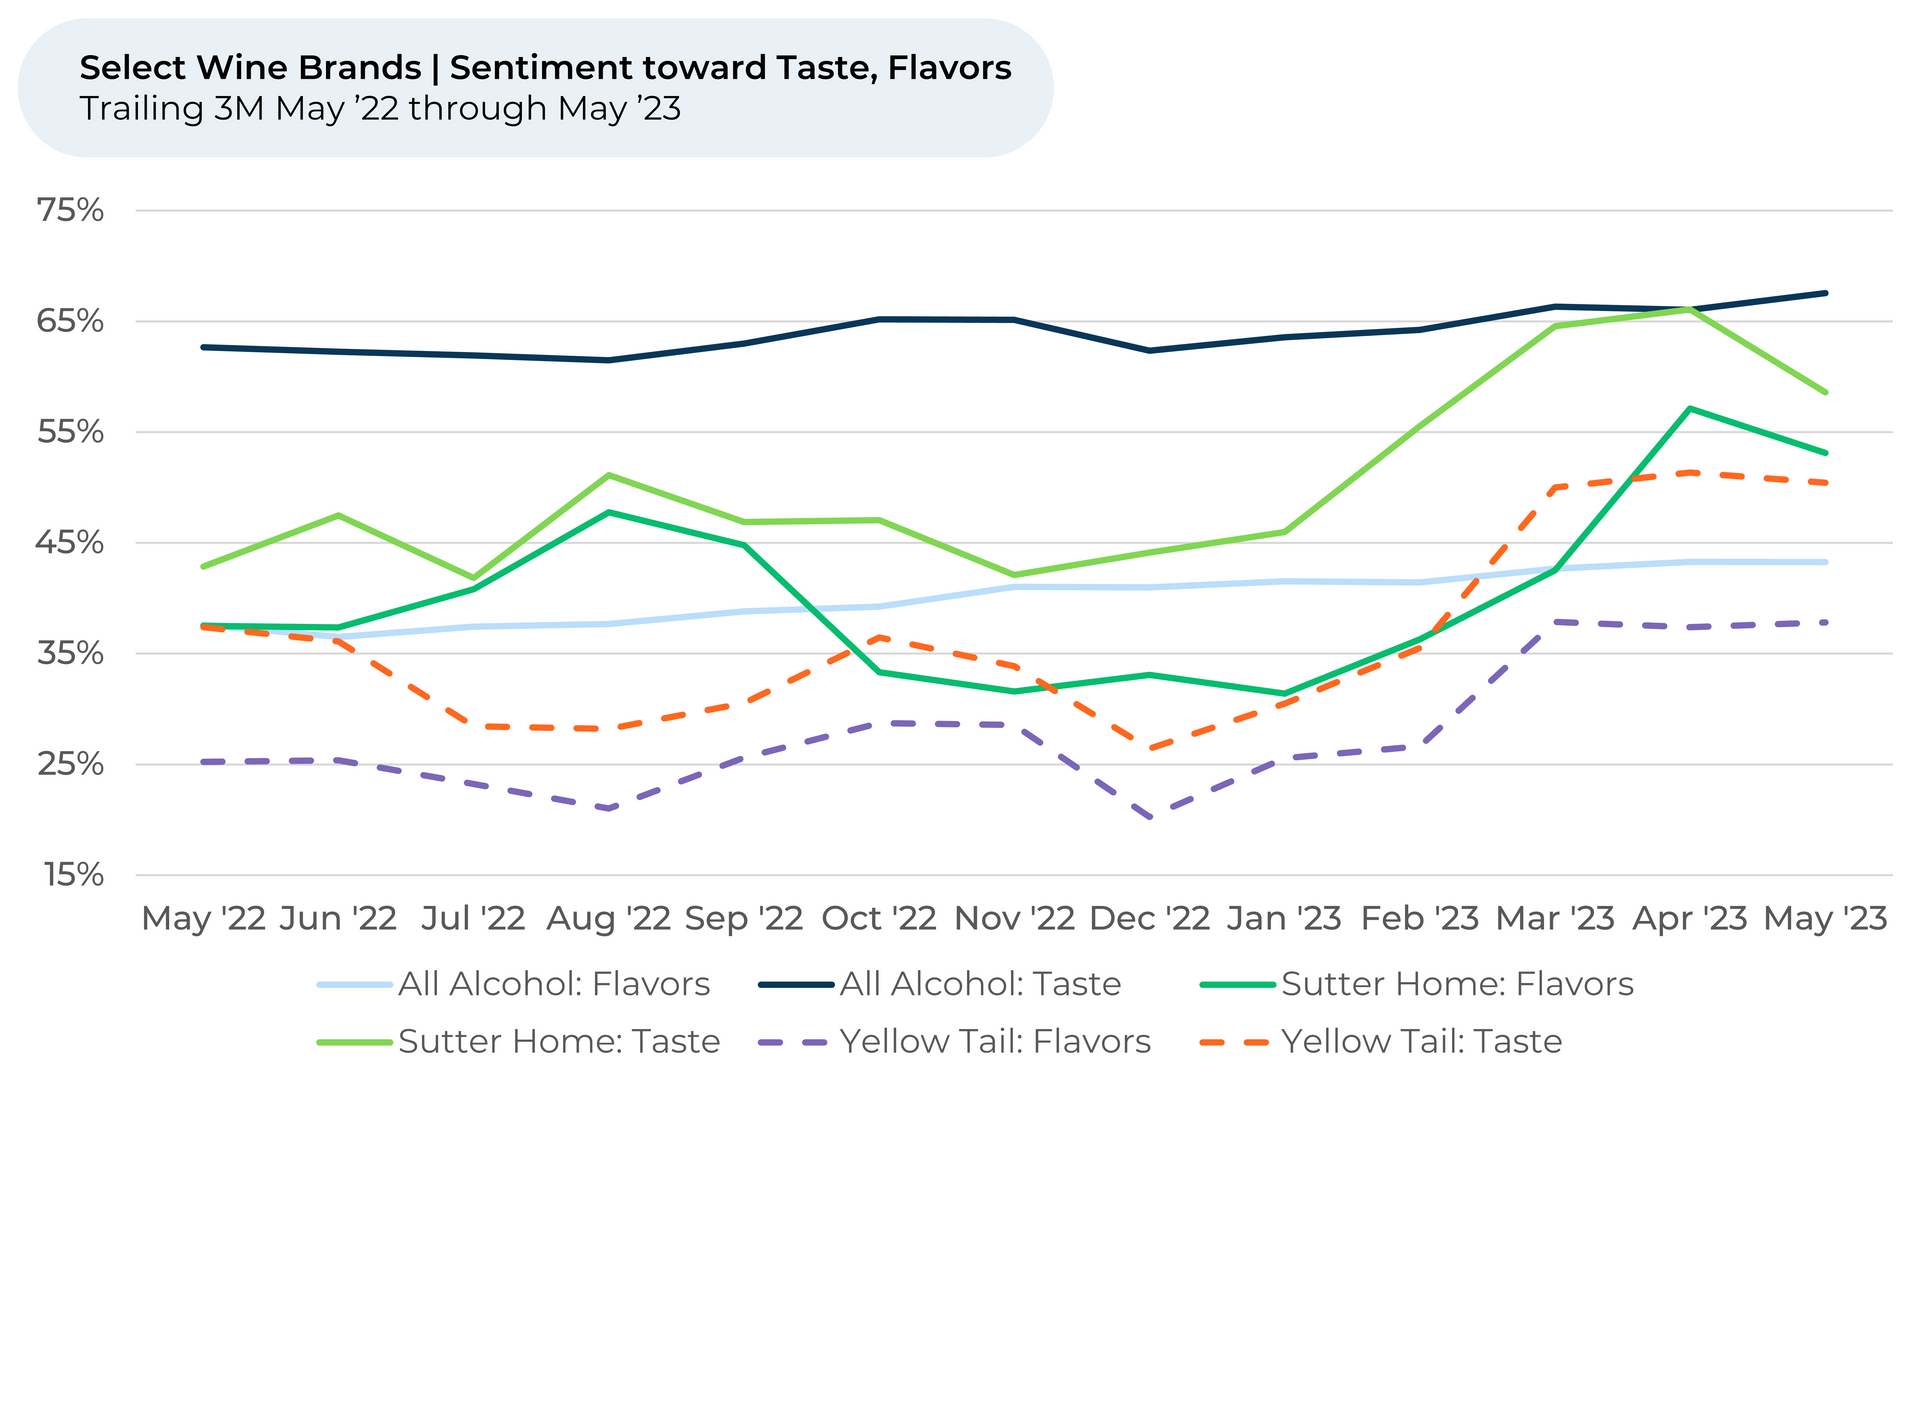
- Sutter Home and Yellow Tail are driving up wine’s Consumption Intent and sentiments toward Flavor and Taste.
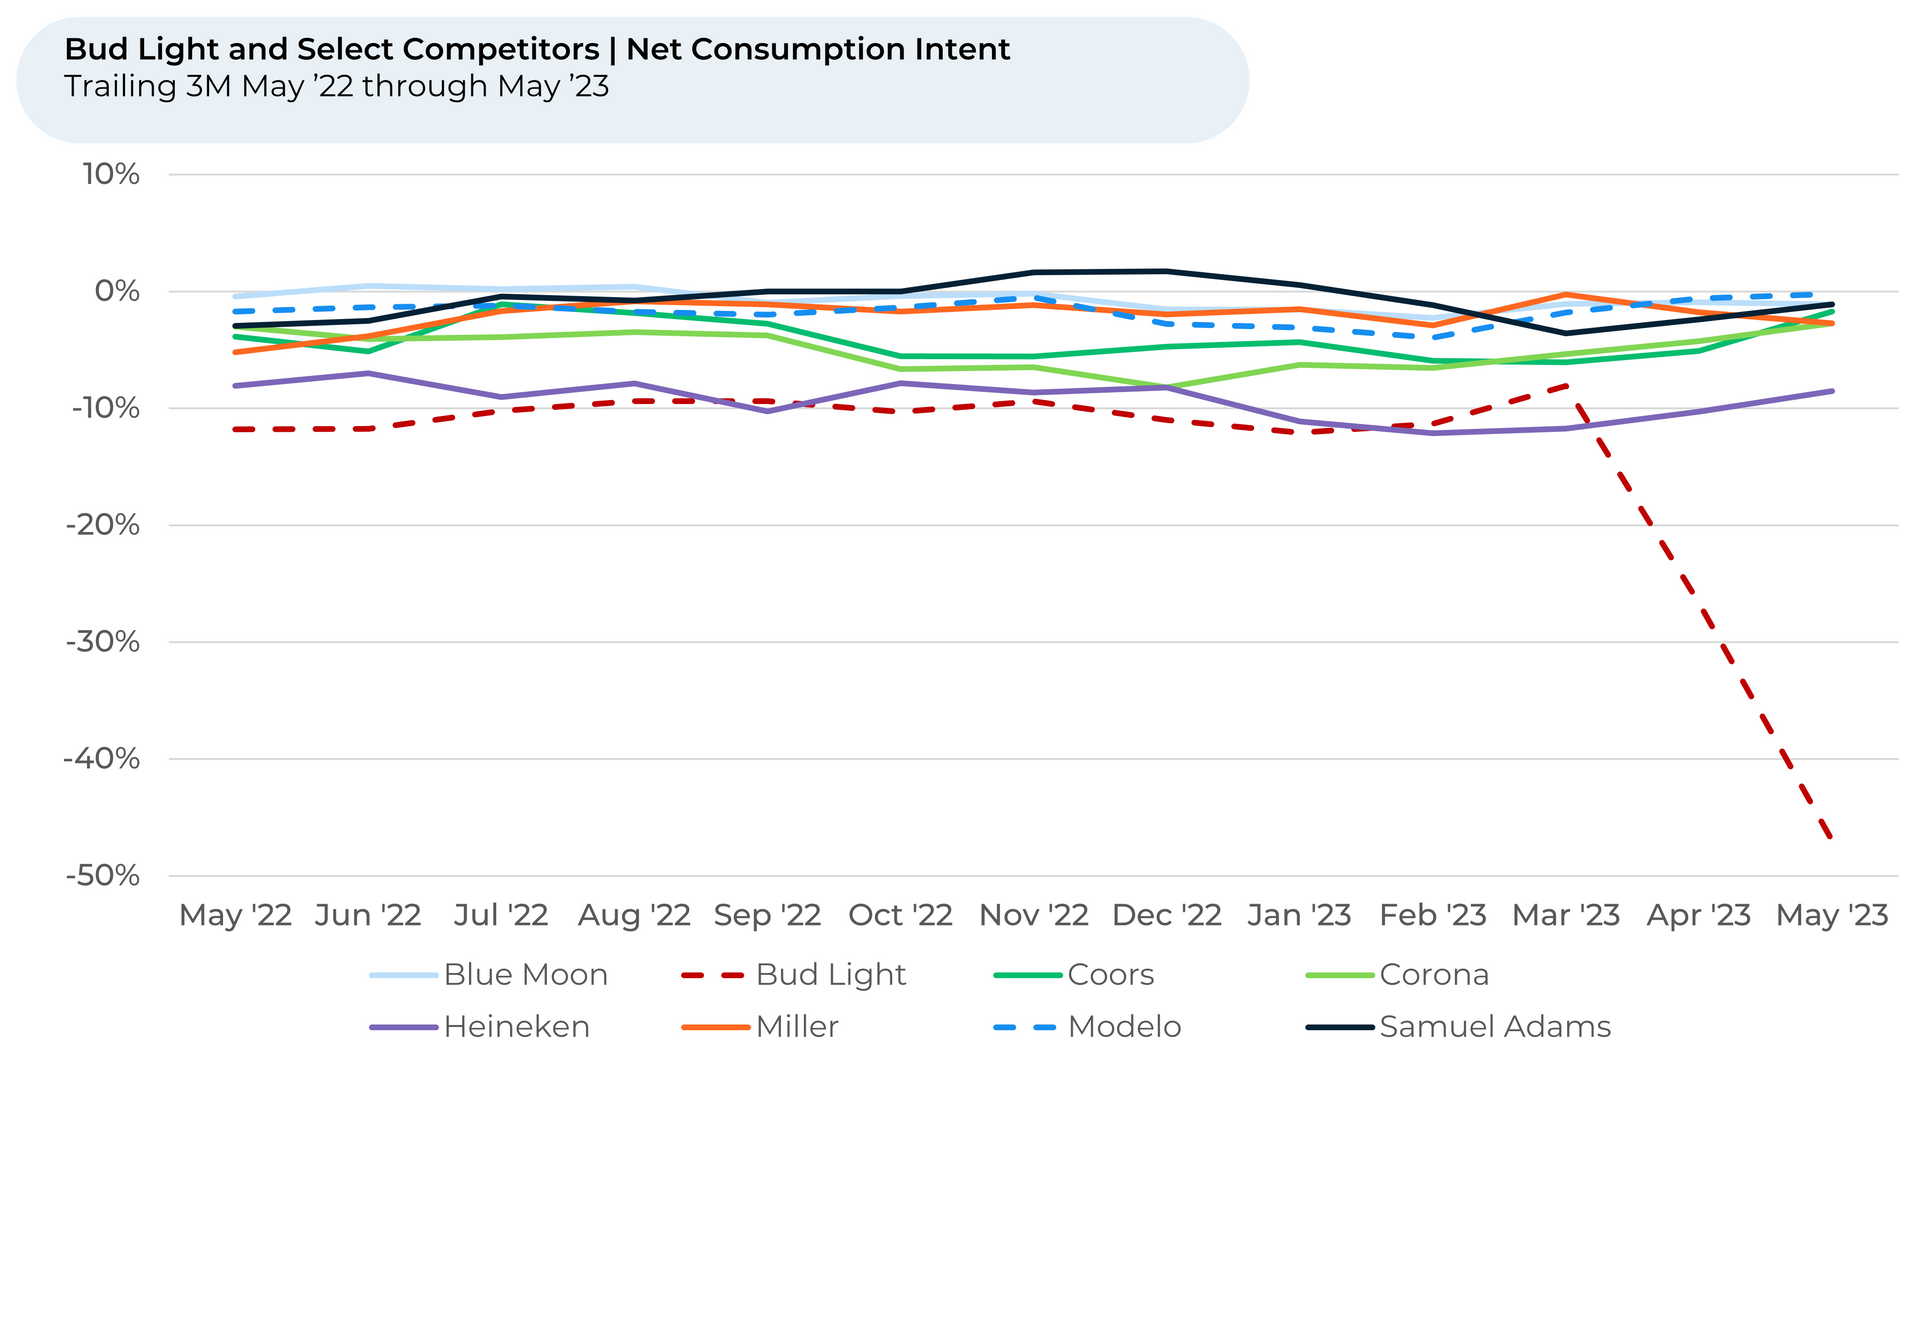
- Consumption Intent for
Bud Light fell dramatically after its promotion with Dylan Mulvaney. Since February, Modelo Consumption Intent increased 4%, and it now tops other major beer brands.
Discover HundredX insights into Alcohol trends:
Please contact our team for a deeper look at HundredX's data on Alcohol and Spirits, which includes more than 100,000 pieces of customer feedback across 66 alcohol brands.
- All metrics presented, including Net Consumption (Consumption Intent) and Net Positive Percent / Sentiment are presented on a trailing three-month basis unless otherwise noted.
- Consumption Intent for alcohol represents the percentage of customers who expect to consume more of that brand over the next 12 months, minus those that intend to consume less.
- HundredX measures sentiment towards a driver of customer satisfaction as Net Positive Percent (NPP), which is the percentage of customers who view a factor as a positive (reason they liked the products, people, or experiences) minus the percentage who see the same factor as a negative.
Strategy Made Smarter
HundredX works with a variety of companies and their investors to answer some of the most important strategy questions in business:
- Where are customers "migrating"?
- What are they saying they will use more of in the next 12 months?
- What are the key drivers of their purchase decisions and financial outcomes?
Current clients see immediate benefits across multiple areas including strategy, finance, operations, pricing, investing, and marketing.
Our insights enable business leaders to define and identify specific drivers and decisions enabling them to grow their market share.
Please contact our team to learn more about which businesses across 75 industries are best positioned with customers and the decisions you can make to grow your brand’s market share.
####
HundredX is a mission-based data and insights provider. HundredX does not make investment recommendations. However, we believe in the wisdom of the crowd to inform the outlook for businesses and industries. For more info on specific drivers of customer satisfaction, other companies within 75+ other industries we cover, or if you'd like to learn more about using Data for Good, please reach out: https://hundredx.com/contact.
Share This Article