Looking to “The Crowd” of smartphone users, HundredX compares customer feedback on the Samsung Galaxy, Google Pixel, and Apple iPhone to determine which ones can potentially gain share in a weak US smartphone market. Examining 17,000+ pieces of customer feedback on those three devices from June 2022 through June 2023, we find:
Key Takeaways
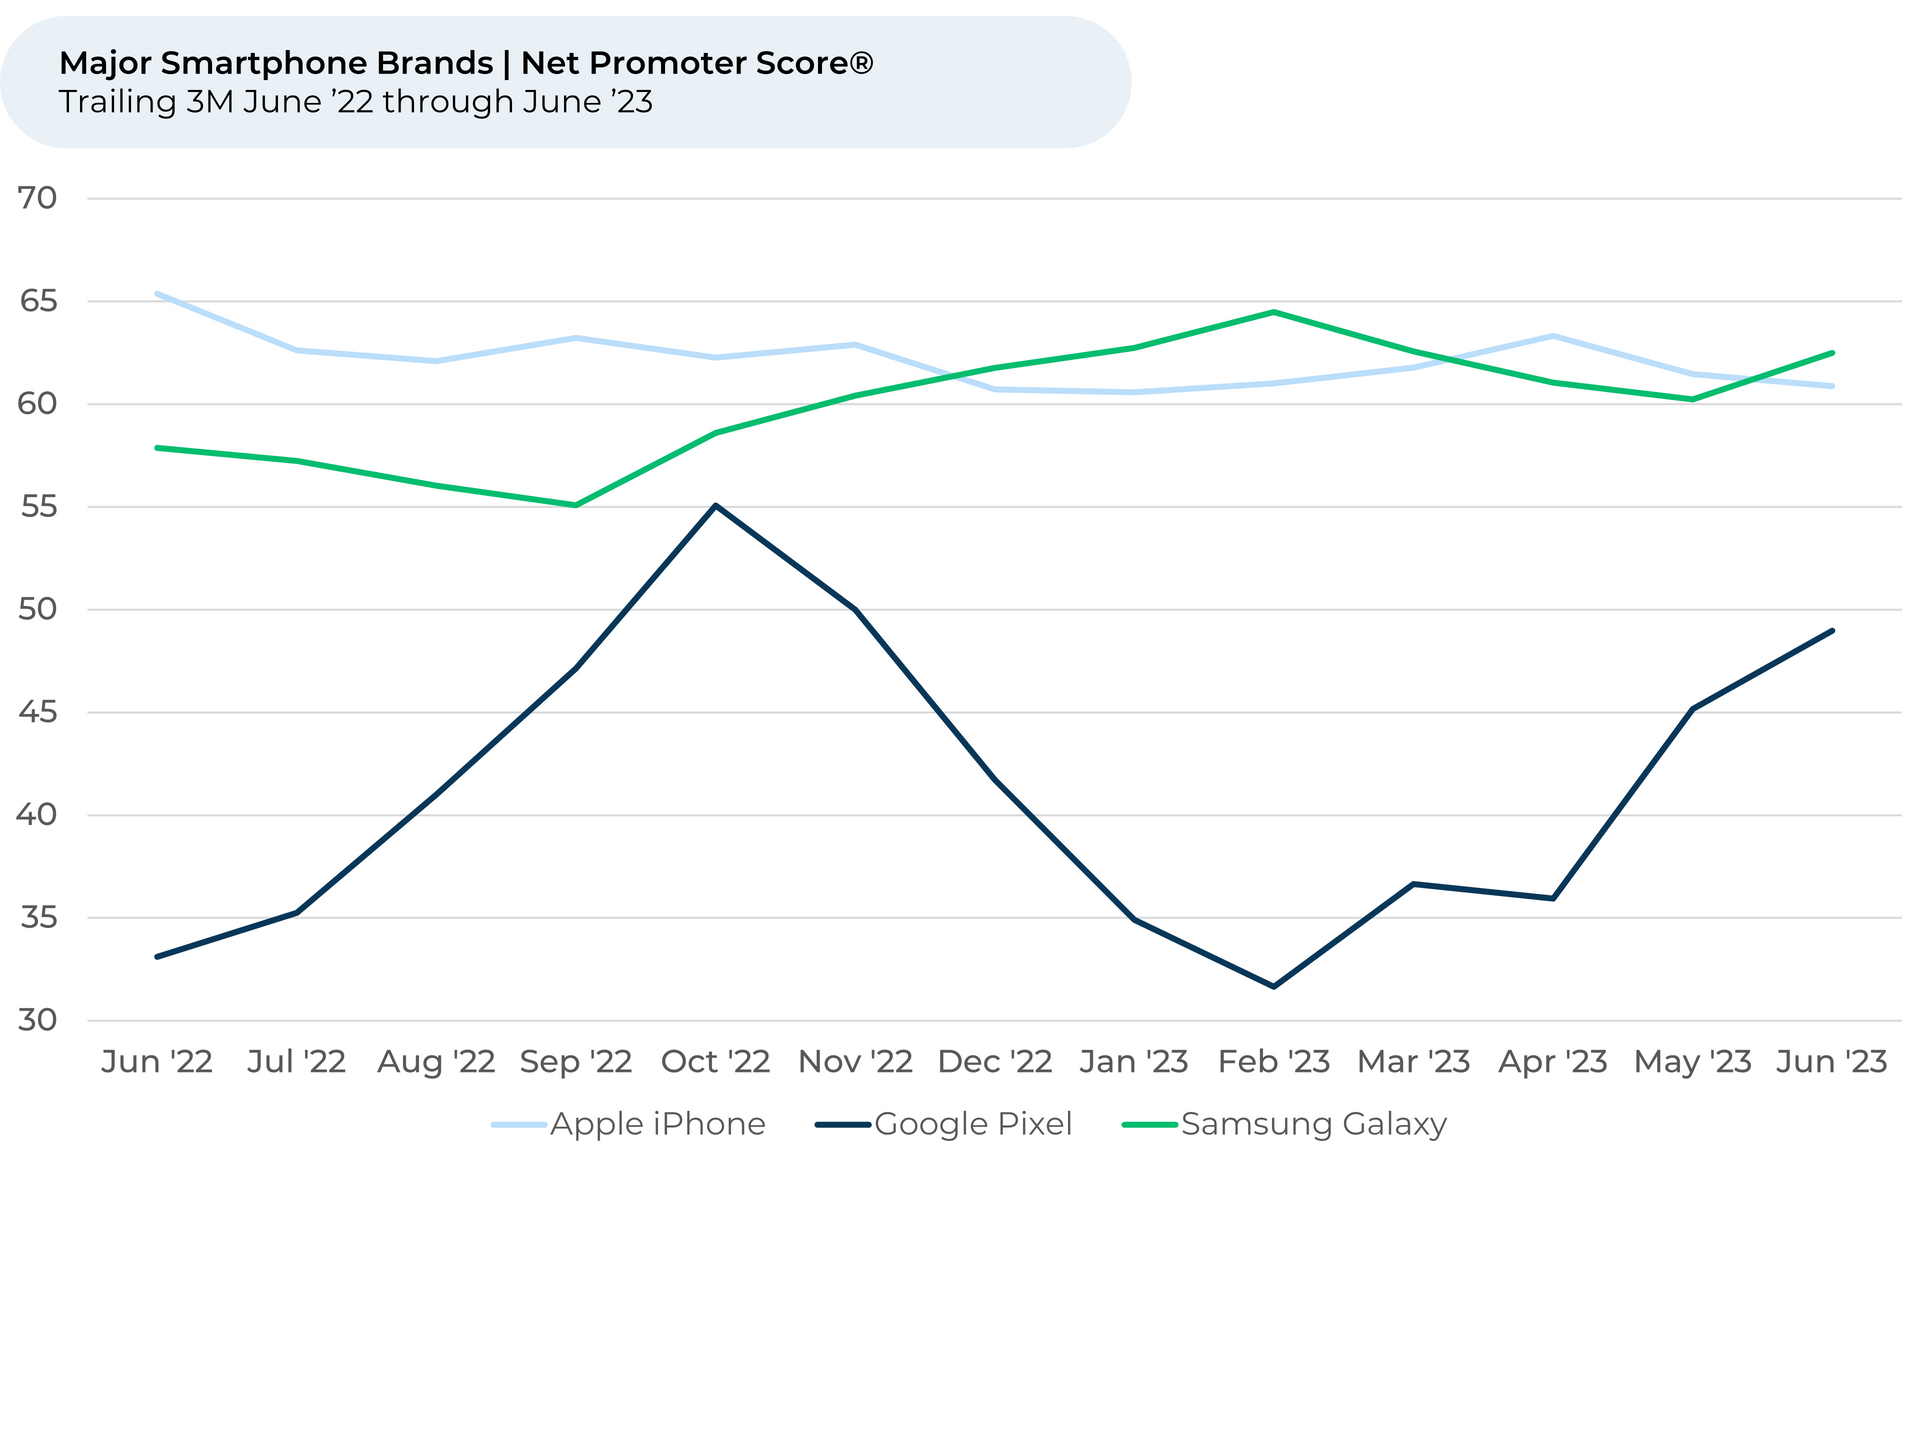
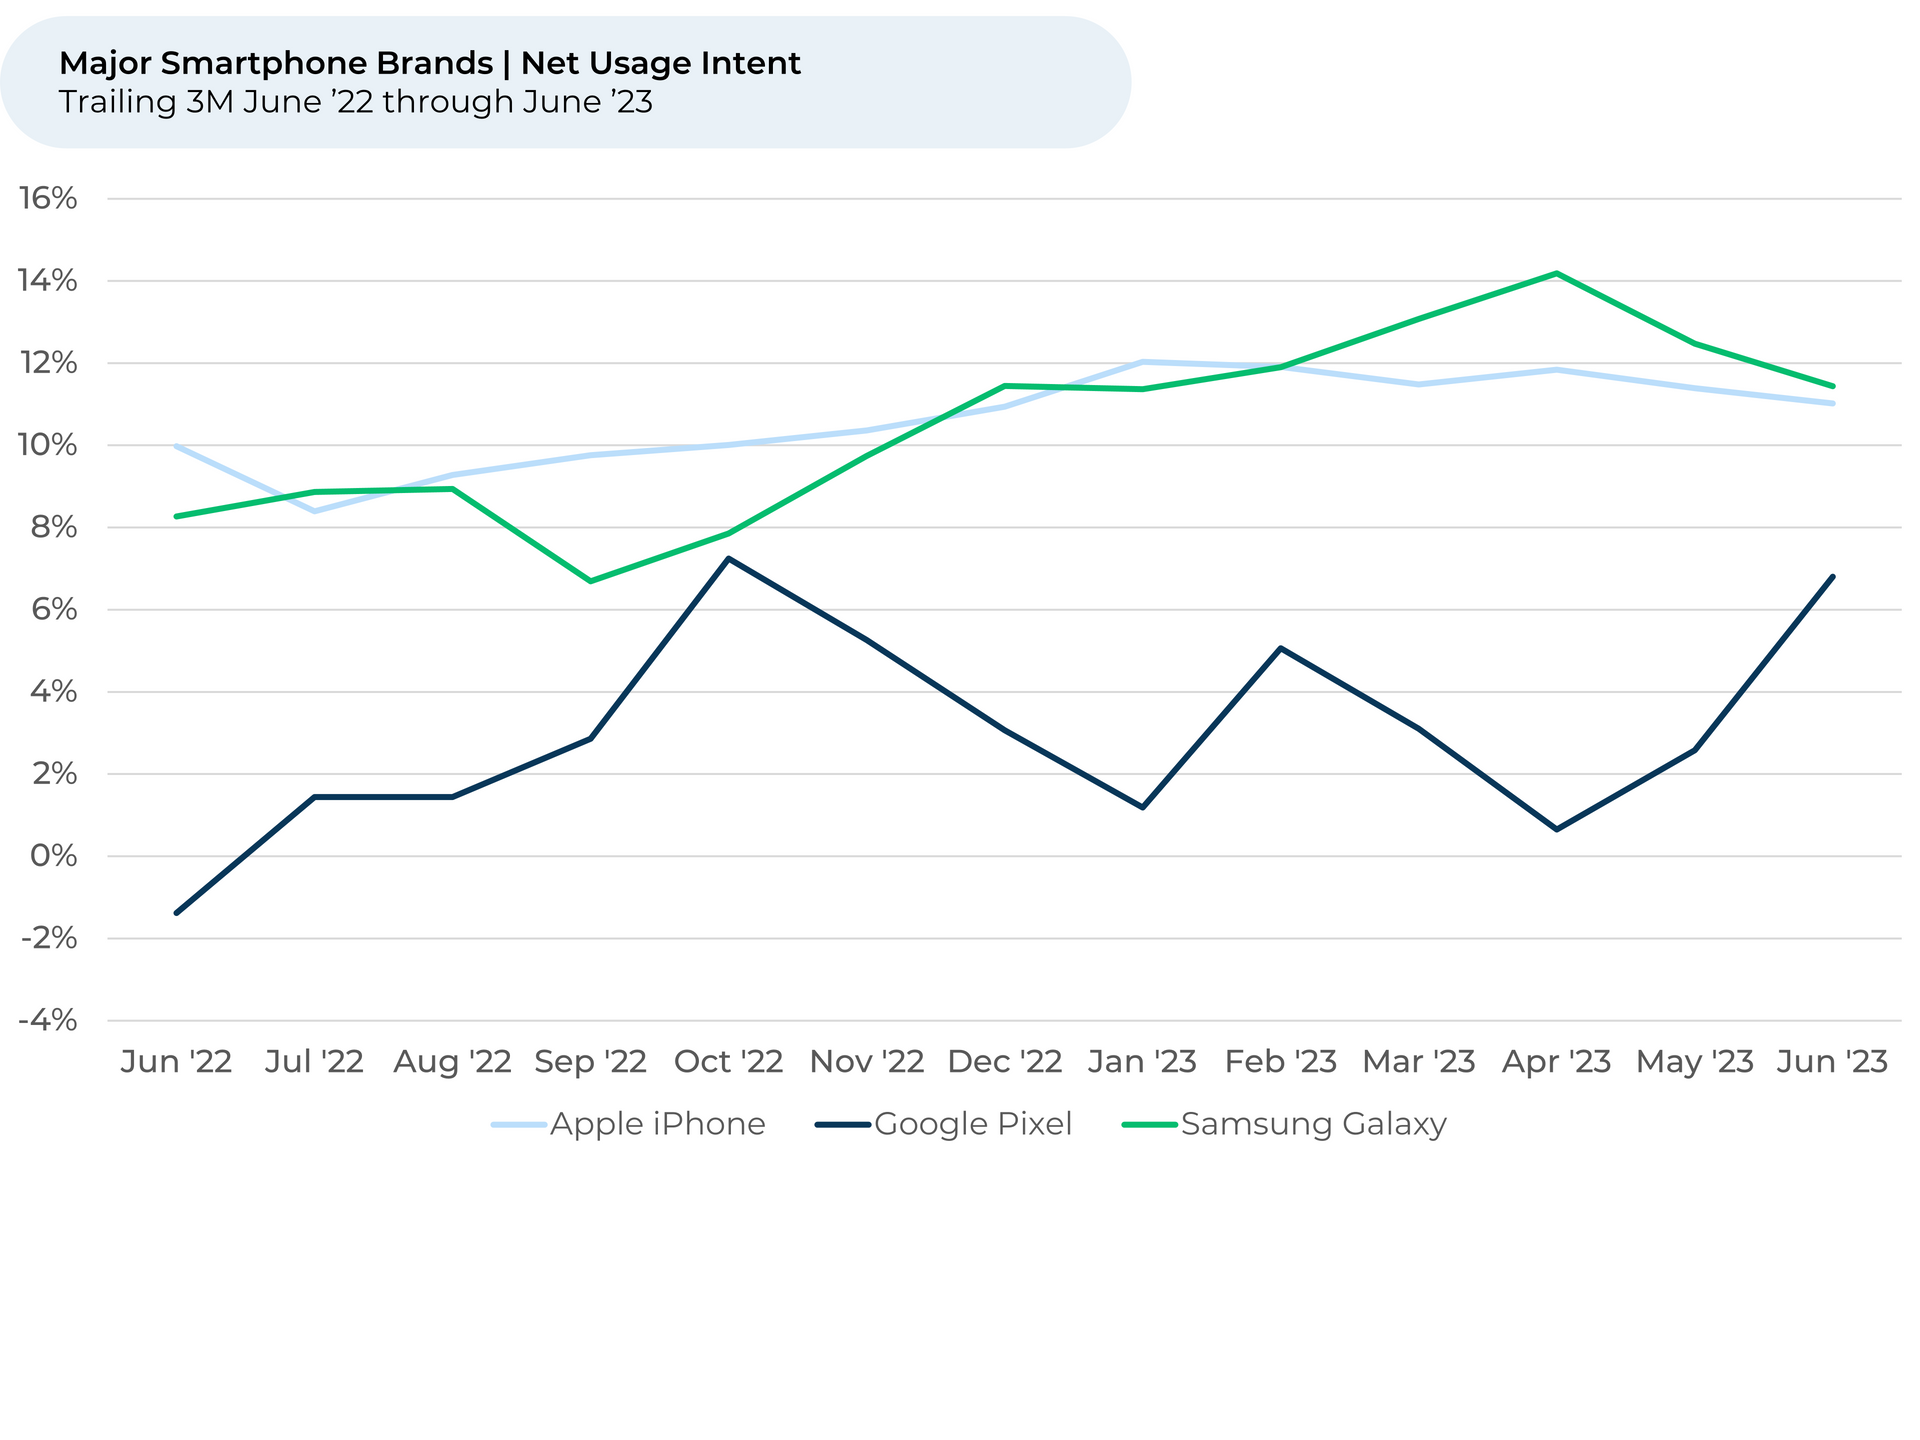
- While Apple gained US market share in 1Q 2023, Google Pixel’s recent increases in Usage Intent1,2 and Net Promoter Score®3 (NPS®) indicate it may gain some ground over the rest of 2023. Google’s 2% share of 1Q 2023 US revenue still significantly lags 57% for Apple and 29% for Samsung.
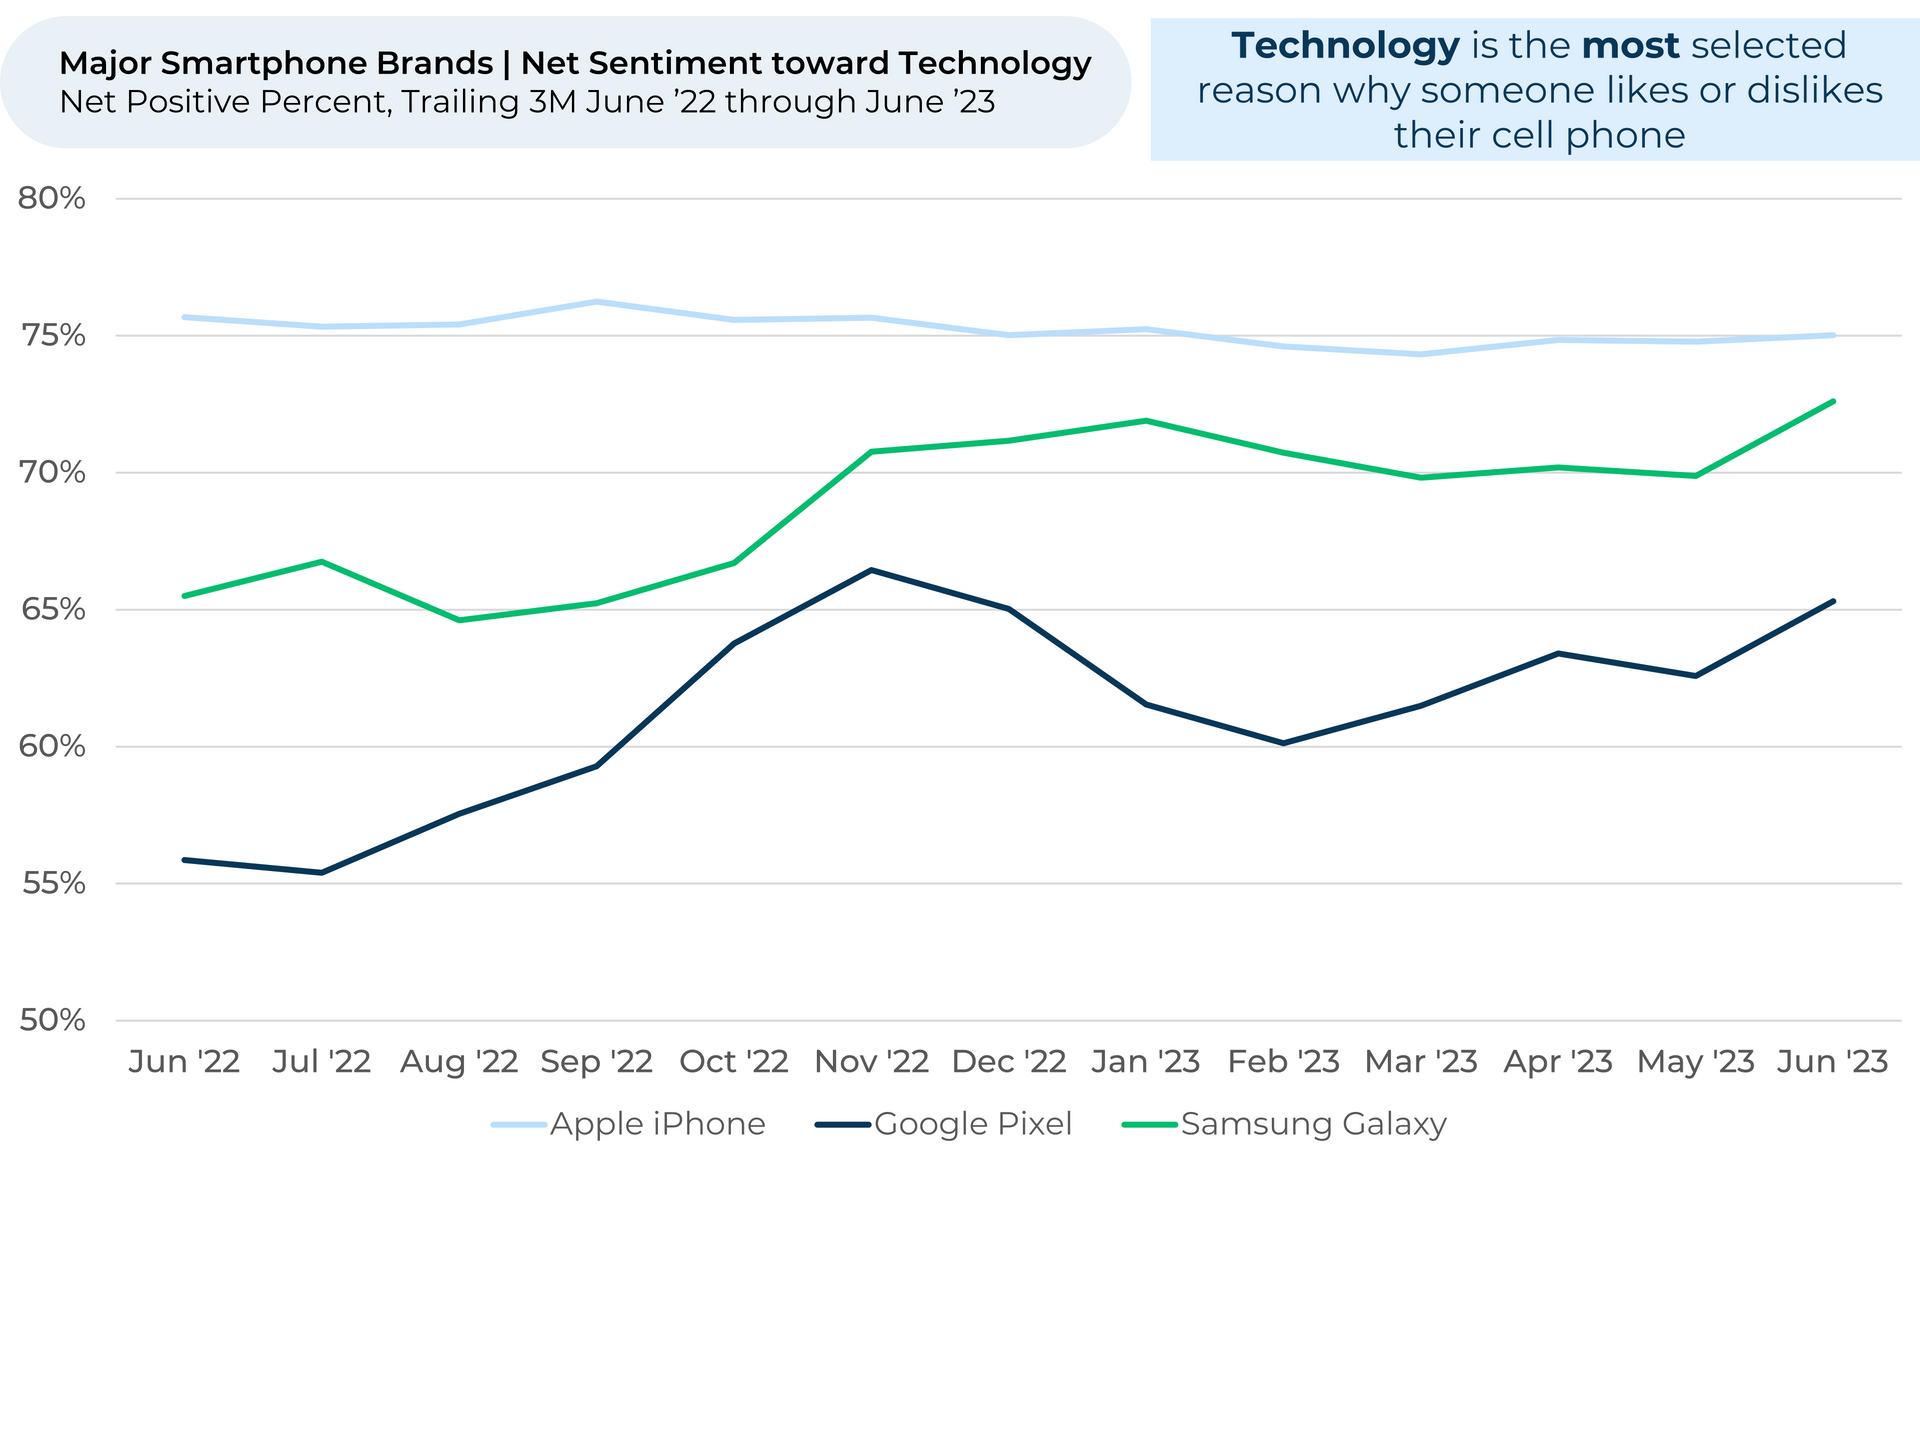
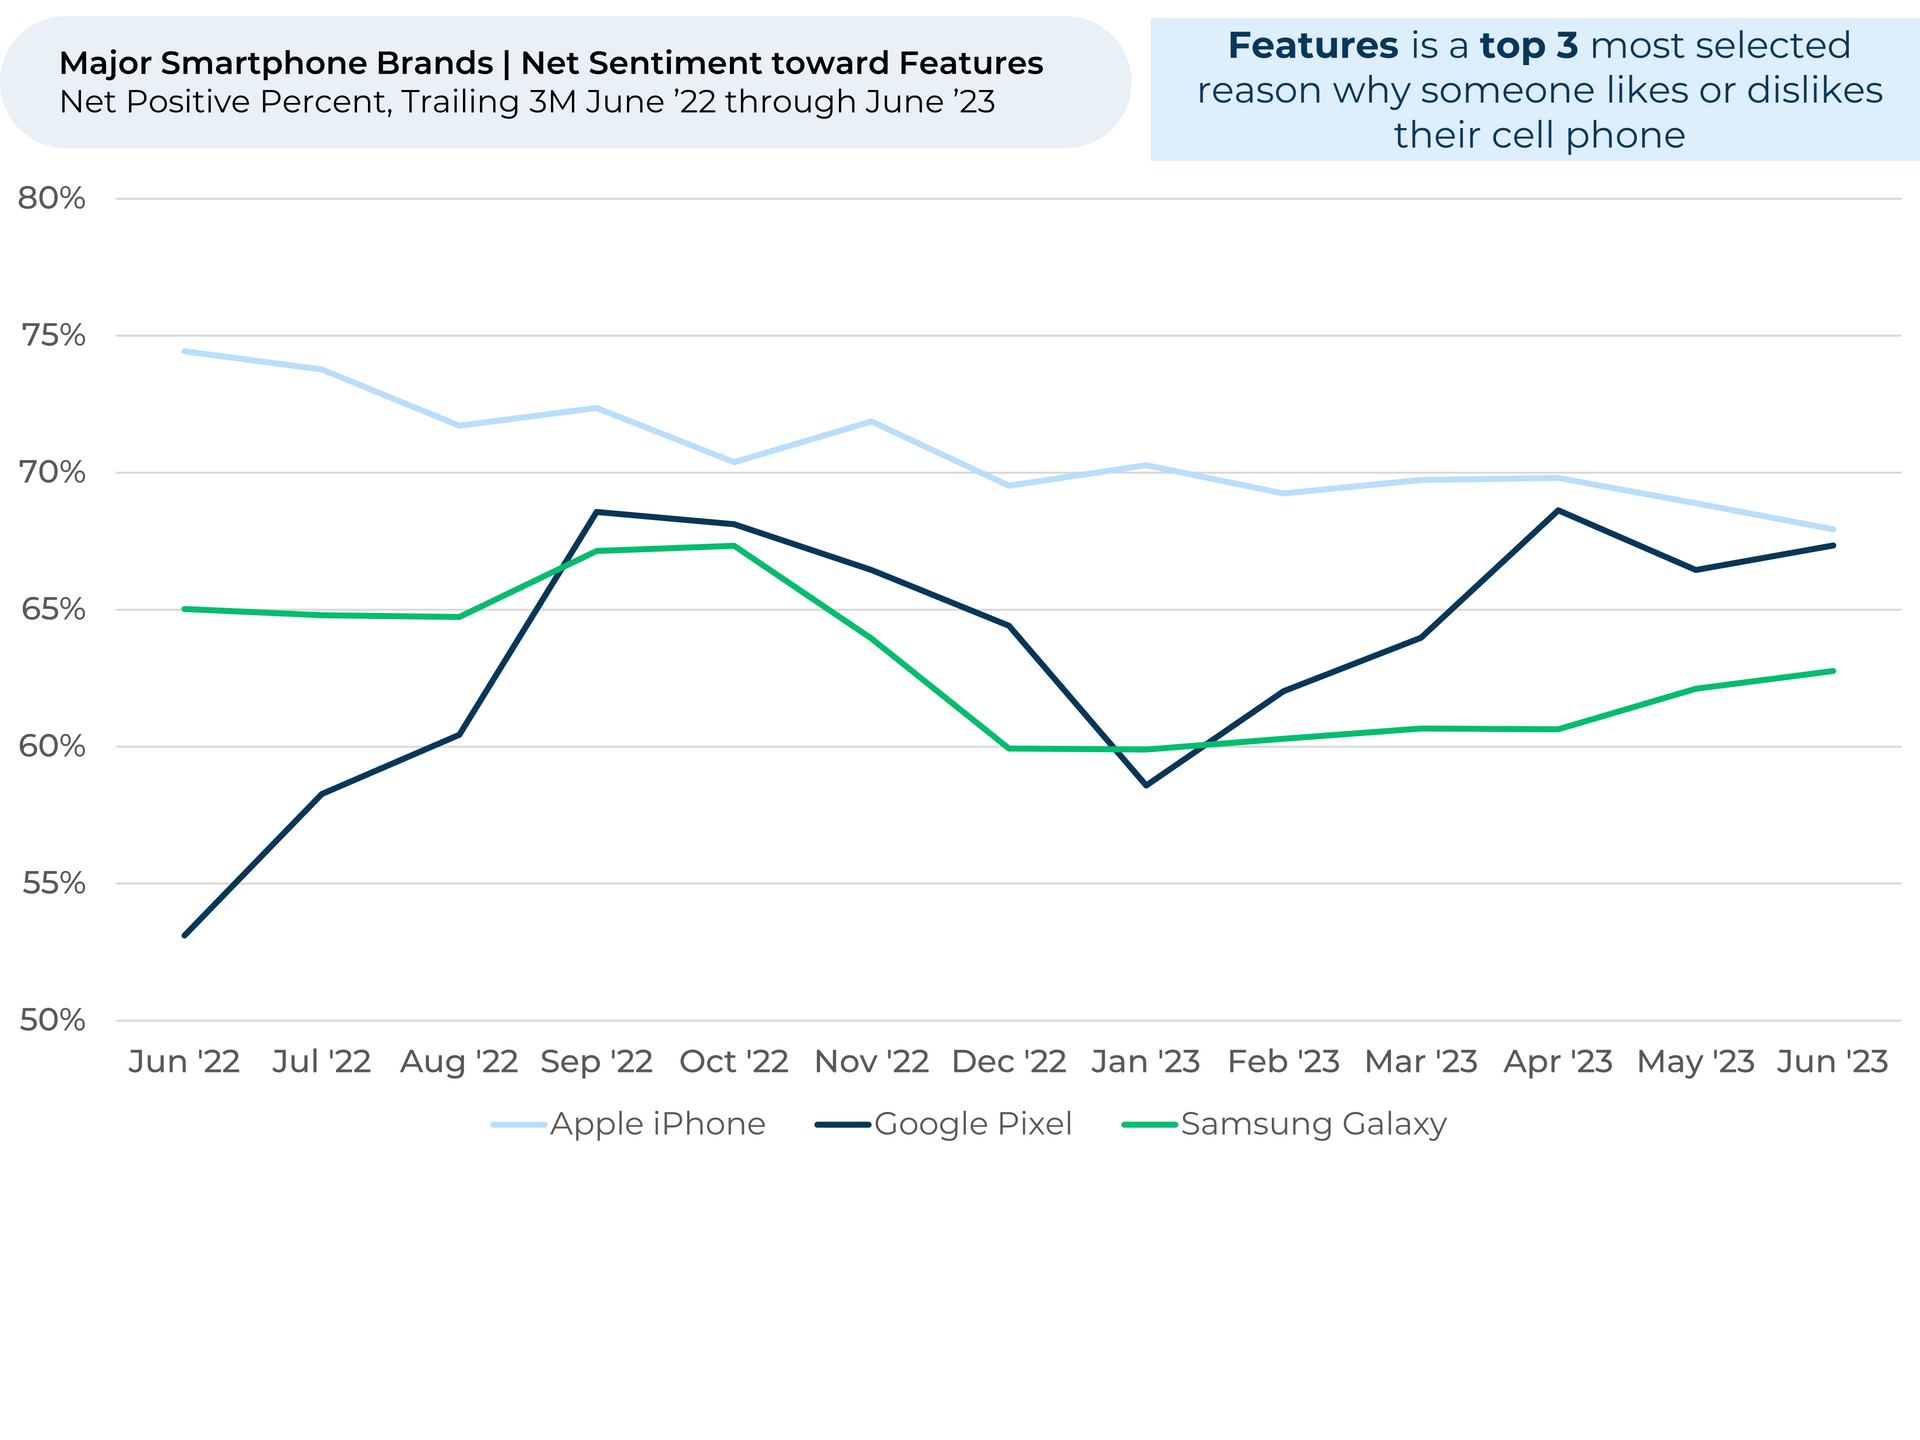
- iPhone’s leads in technology and features appears to be narrowing, with customers increasingly liking the tech in Pixel and Galaxy phones and liking the features for iPhone less.
- Net sentiment4 towards Technology grew 4% / 3% for Pixel / Galaxy respectively the last three months vs. 1% for iPhone. Over the last year, Pixel / Galaxy net sentiment are up 7% / 10% vs. iPhone dipping 1%.
- Google Pixel’s surge corresponds to the launch of Google’s first foldable phone in June, as well as new privacy and security features and call-enhancing tools.
- Customers are also less happy about iPhone features, with net sentiment towards Features dropping 2% / 7% over the past three months / one year. Recent iOS updates have not had material feature additions.
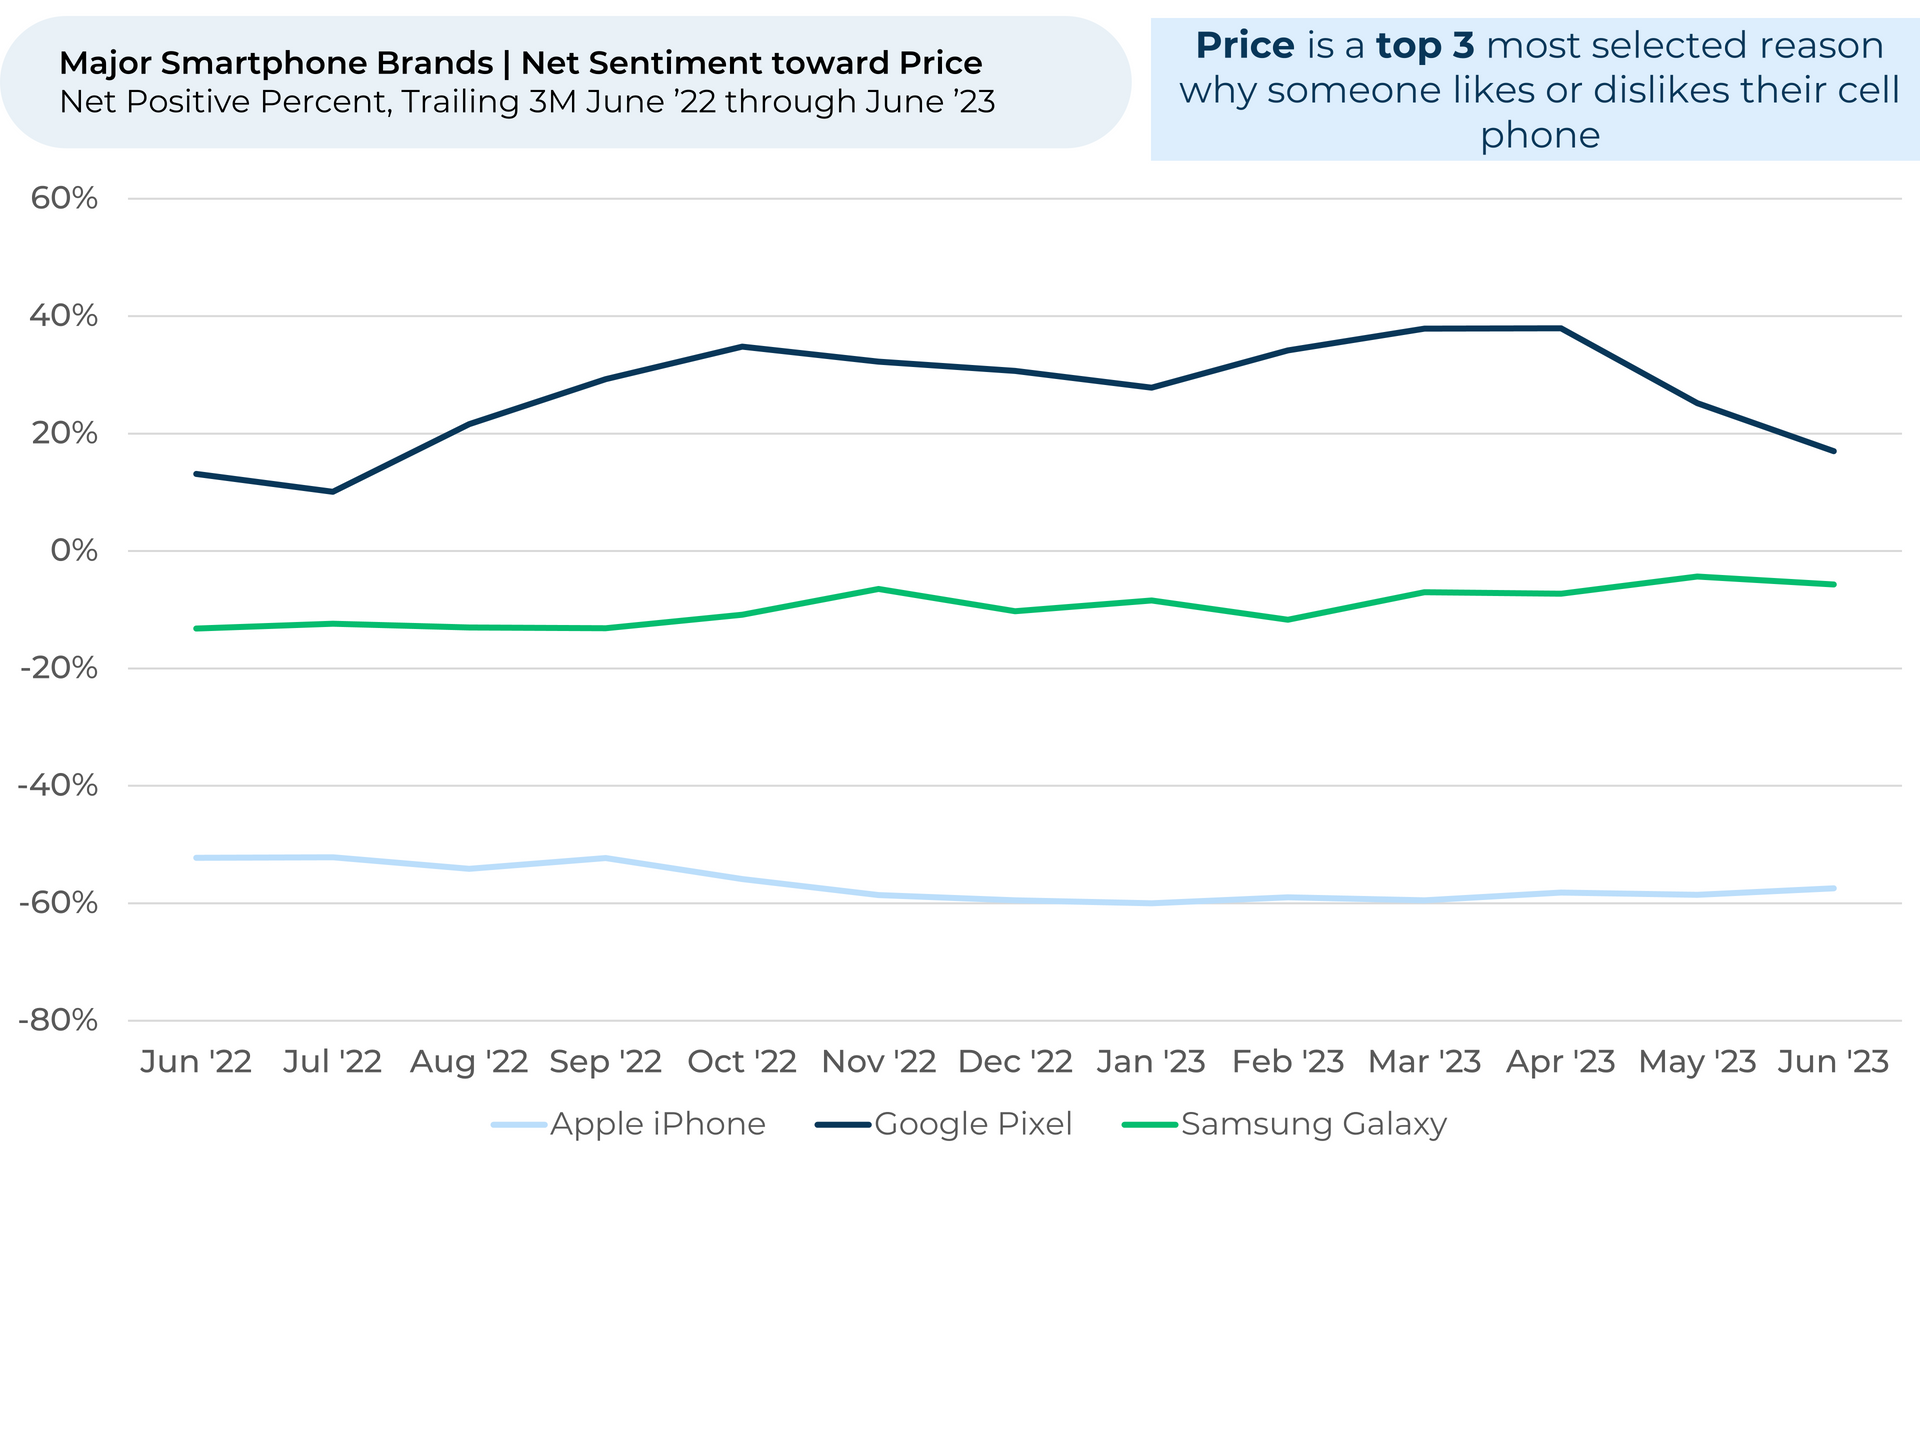
- Despite its recent gains in other metrics, Pixel dropped significantly in net sentiment toward Price (21%) over the past three months. In May, Google raised the price on its Pixel 7a discounted model to be $50 more than last year’s model.
Discover HundredX insights into Smartphone Trends:
Please contact our team for a deeper look at HundredX's consumer products data, which includes 250,000 pieces of customer feedback across over 62 electronics brands (including over 42,000 on these three phone brands) and 160,000 pieces of feedback on wireless providers.
- All metrics presented, including Net Usage Intent (Usage Intent), and Net Positive Percent / Net Sentiment are presented on a trailing three-month basis unless otherwise noted.
- Usage Intent reflects the percentage of customers who plan to use a specific brand more during the next 12 months, minus the percentage who plan to use less. We find businesses that see customer Intent trends gain versus the industry have often seen revenue growth rates, margins and/or market share also improve versus peers.
- Net Promoter Score® (NPS®) measures a customer’s willingness to recommend a given brand to a friend, on a scale of 1 to 10. The metric represents the percentage of customers who are promoters (answering 9 or 10) minus the percentage who are detractors (answering 6 or less). NPS® is a registered trademark of Bain & Company, Inc., NICE Systems, Inc., and Fred Reichheld.
- HundredX measures net sentiment towards a driver of customer satisfaction as Net Positive Percent (NPP), which is the percentage of customers who view a factor as a positive (reason they liked the products, people, or experiences) minus the percentage who see the same factor as a negative.
Strategy Made Smarter
HundredX works with a variety of companies and their investors to answer some of the most important strategy questions in business:
- Where are customers "migrating"?
- What are they saying they will use more of in the next 12 months?
- What are the key drivers of their purchase decisions and financial outcomes?
Current clients see immediate benefits across multiple areas including strategy, finance, operations, pricing, investing, and marketing.
Our insights enable business leaders to define and identify specific drivers and decisions enabling them to grow their market share.
Please contact our team to learn more about which businesses across 75 industries are best positioned with customers and the decisions you can make to grow your brand’s market share.
####
HundredX is a mission-based data and insights provider. HundredX does not make investment recommendations. However, we believe in the wisdom of the crowd to inform the outlook for businesses and industries. For more info on specific drivers of customer satisfaction, other companies within 75+ other industries we cover, or if you'd like to learn more about using Data for Good, please reach out: https://hundredx.com/contact.
Share This Article