Who doesn’t love fast food? It may not be the healthiest meal, but it sure tastes good.


Looking to “The Crowd” of Quick, Fast, Casual (QFC) restaurant goers, HundredX examines which types of fast food customers think taste best. Examining 400,000+ pieces of customer feedback, June 2022 through June 2023, across over 180 QFC brands, we find: 

Key Takeaways

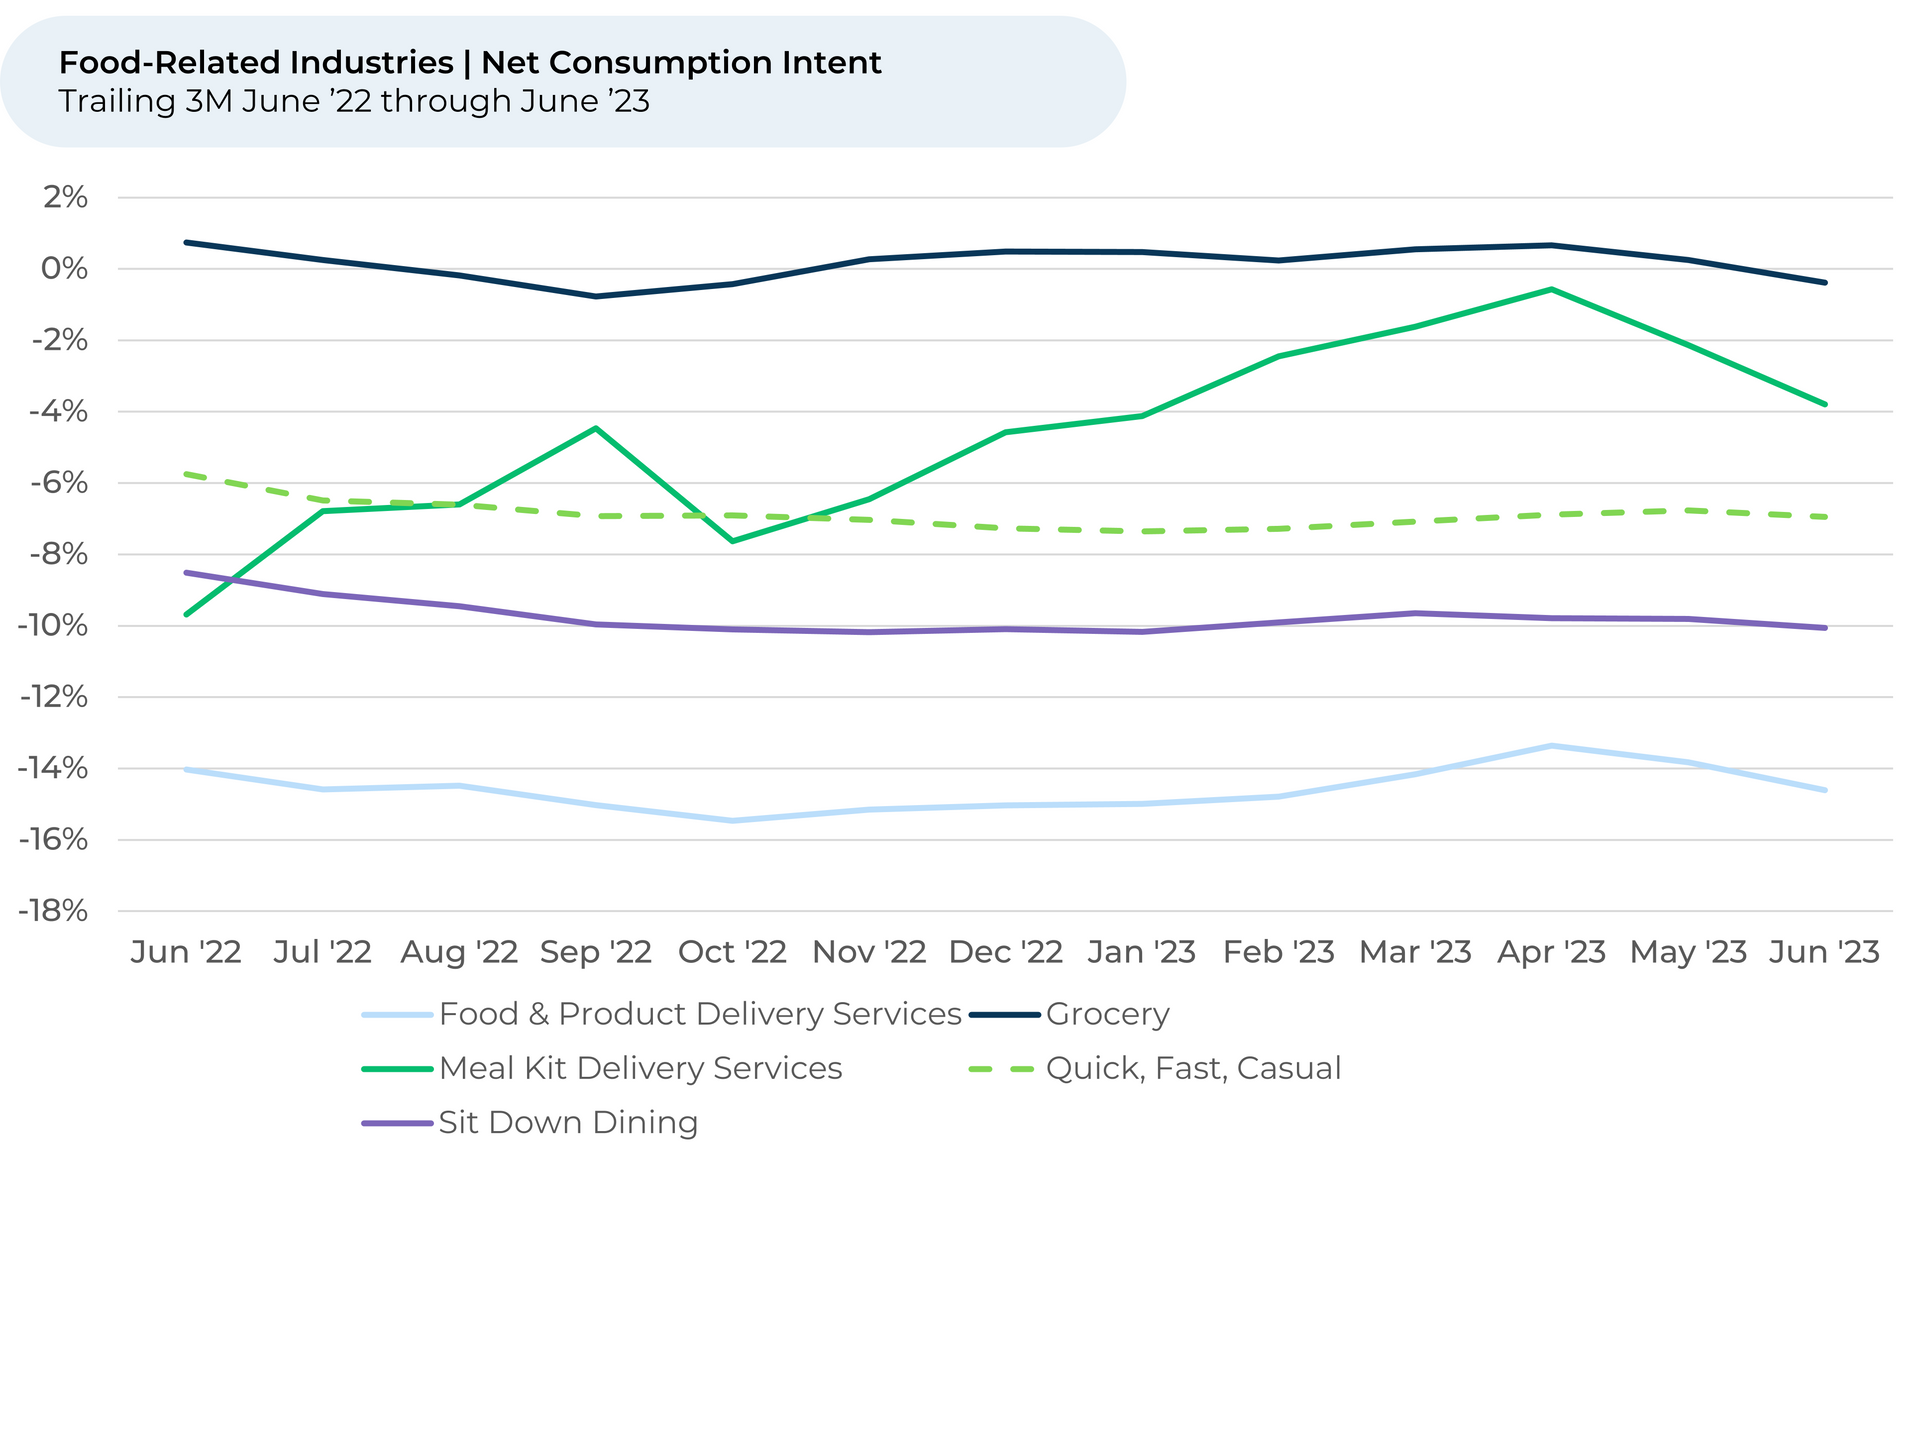
  • Customers’ intent to eat at QFC restaurants has remained unchanged over the past three months. Consumption Intent1,2 for grocery stores and meal kits dropped slightly.
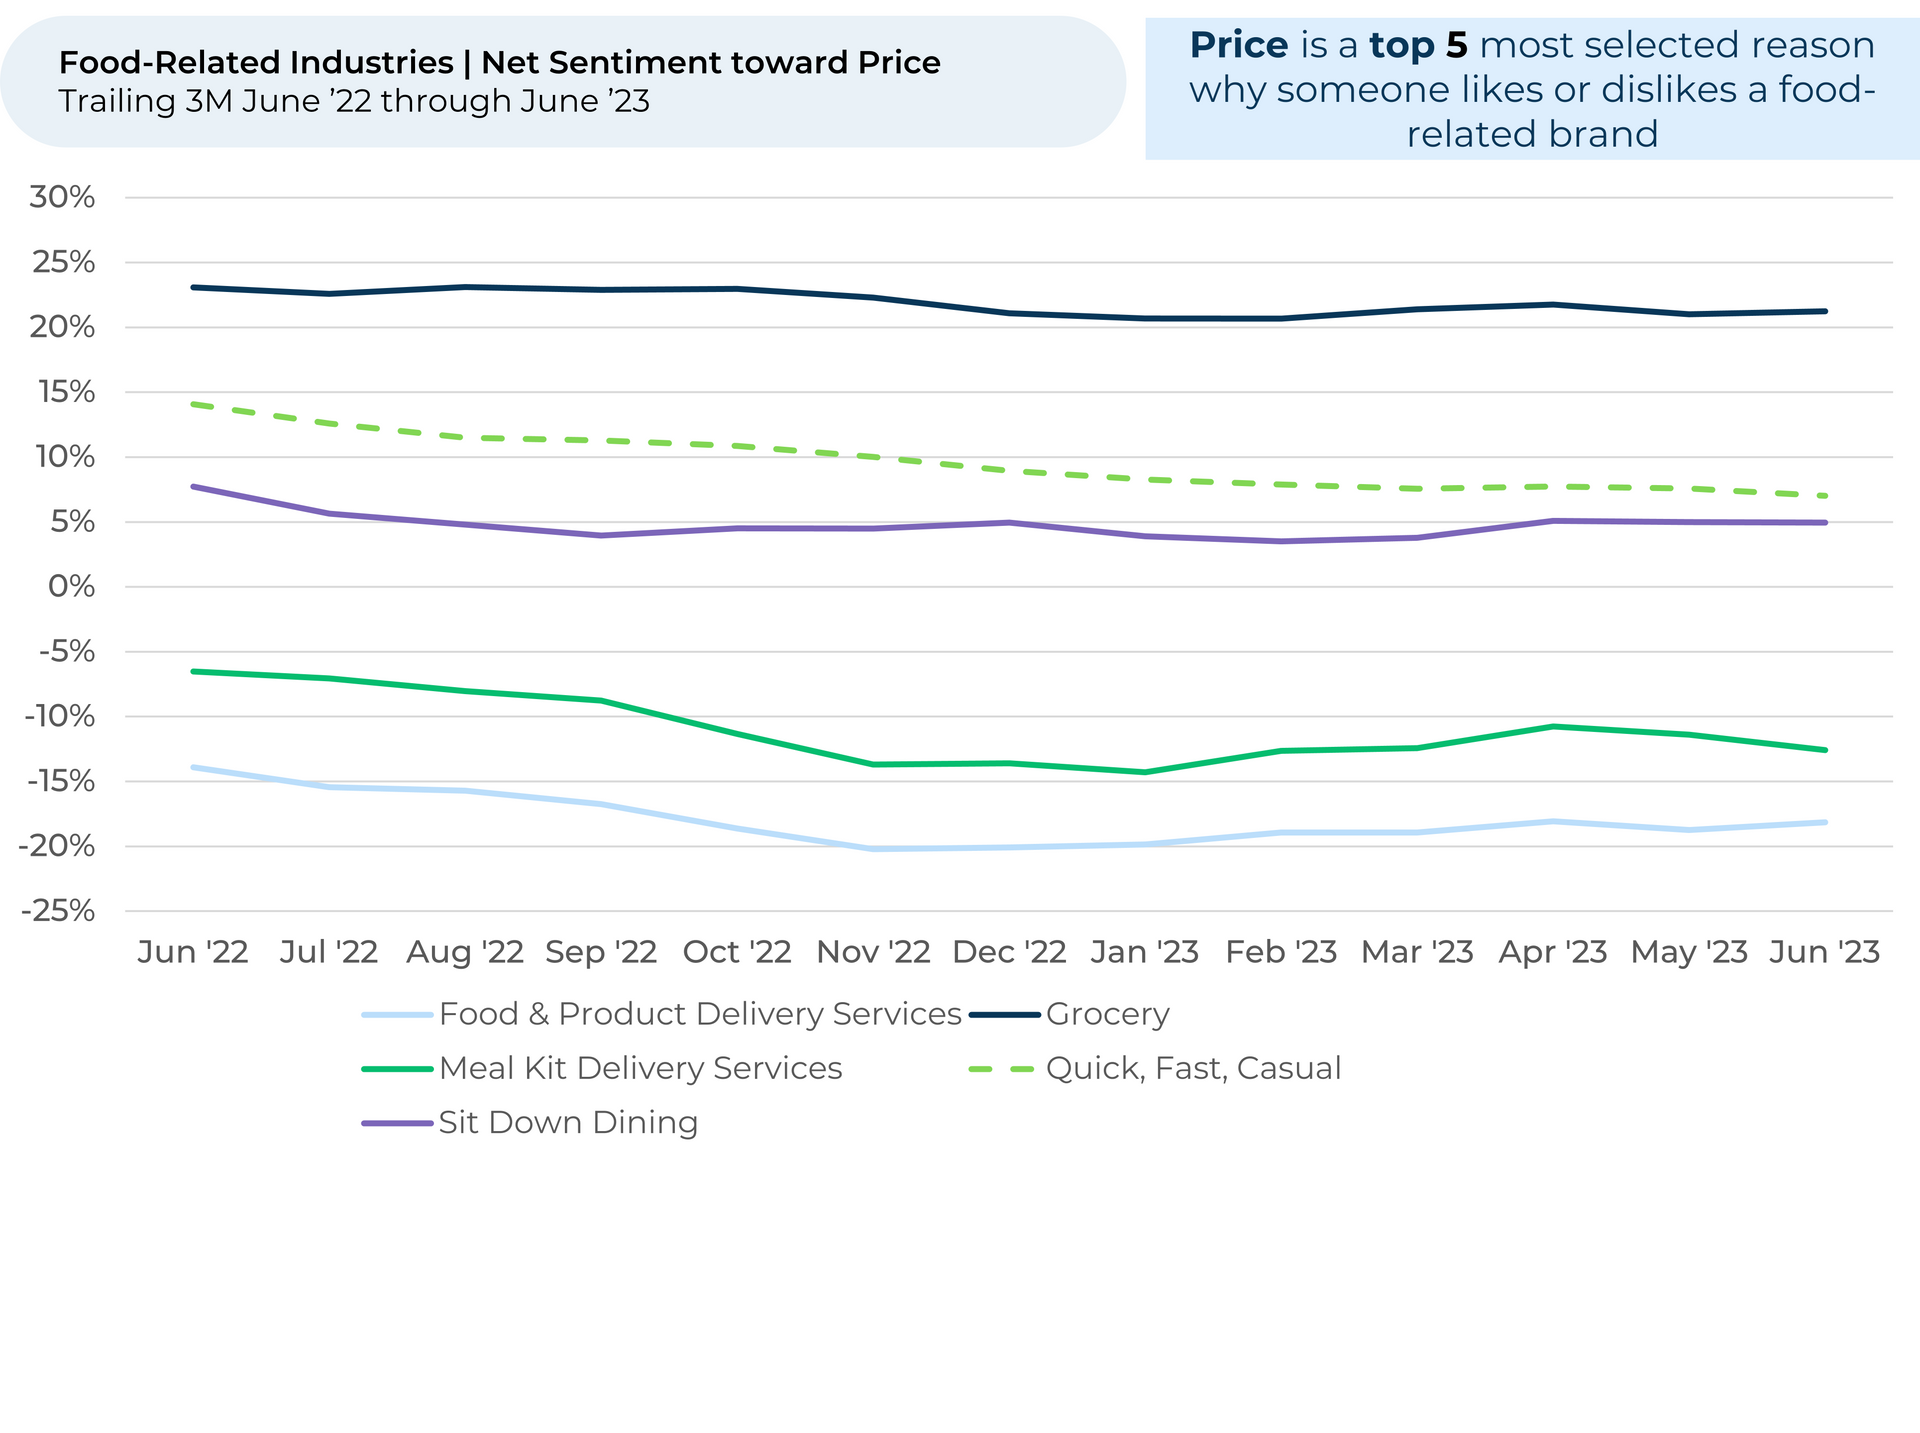
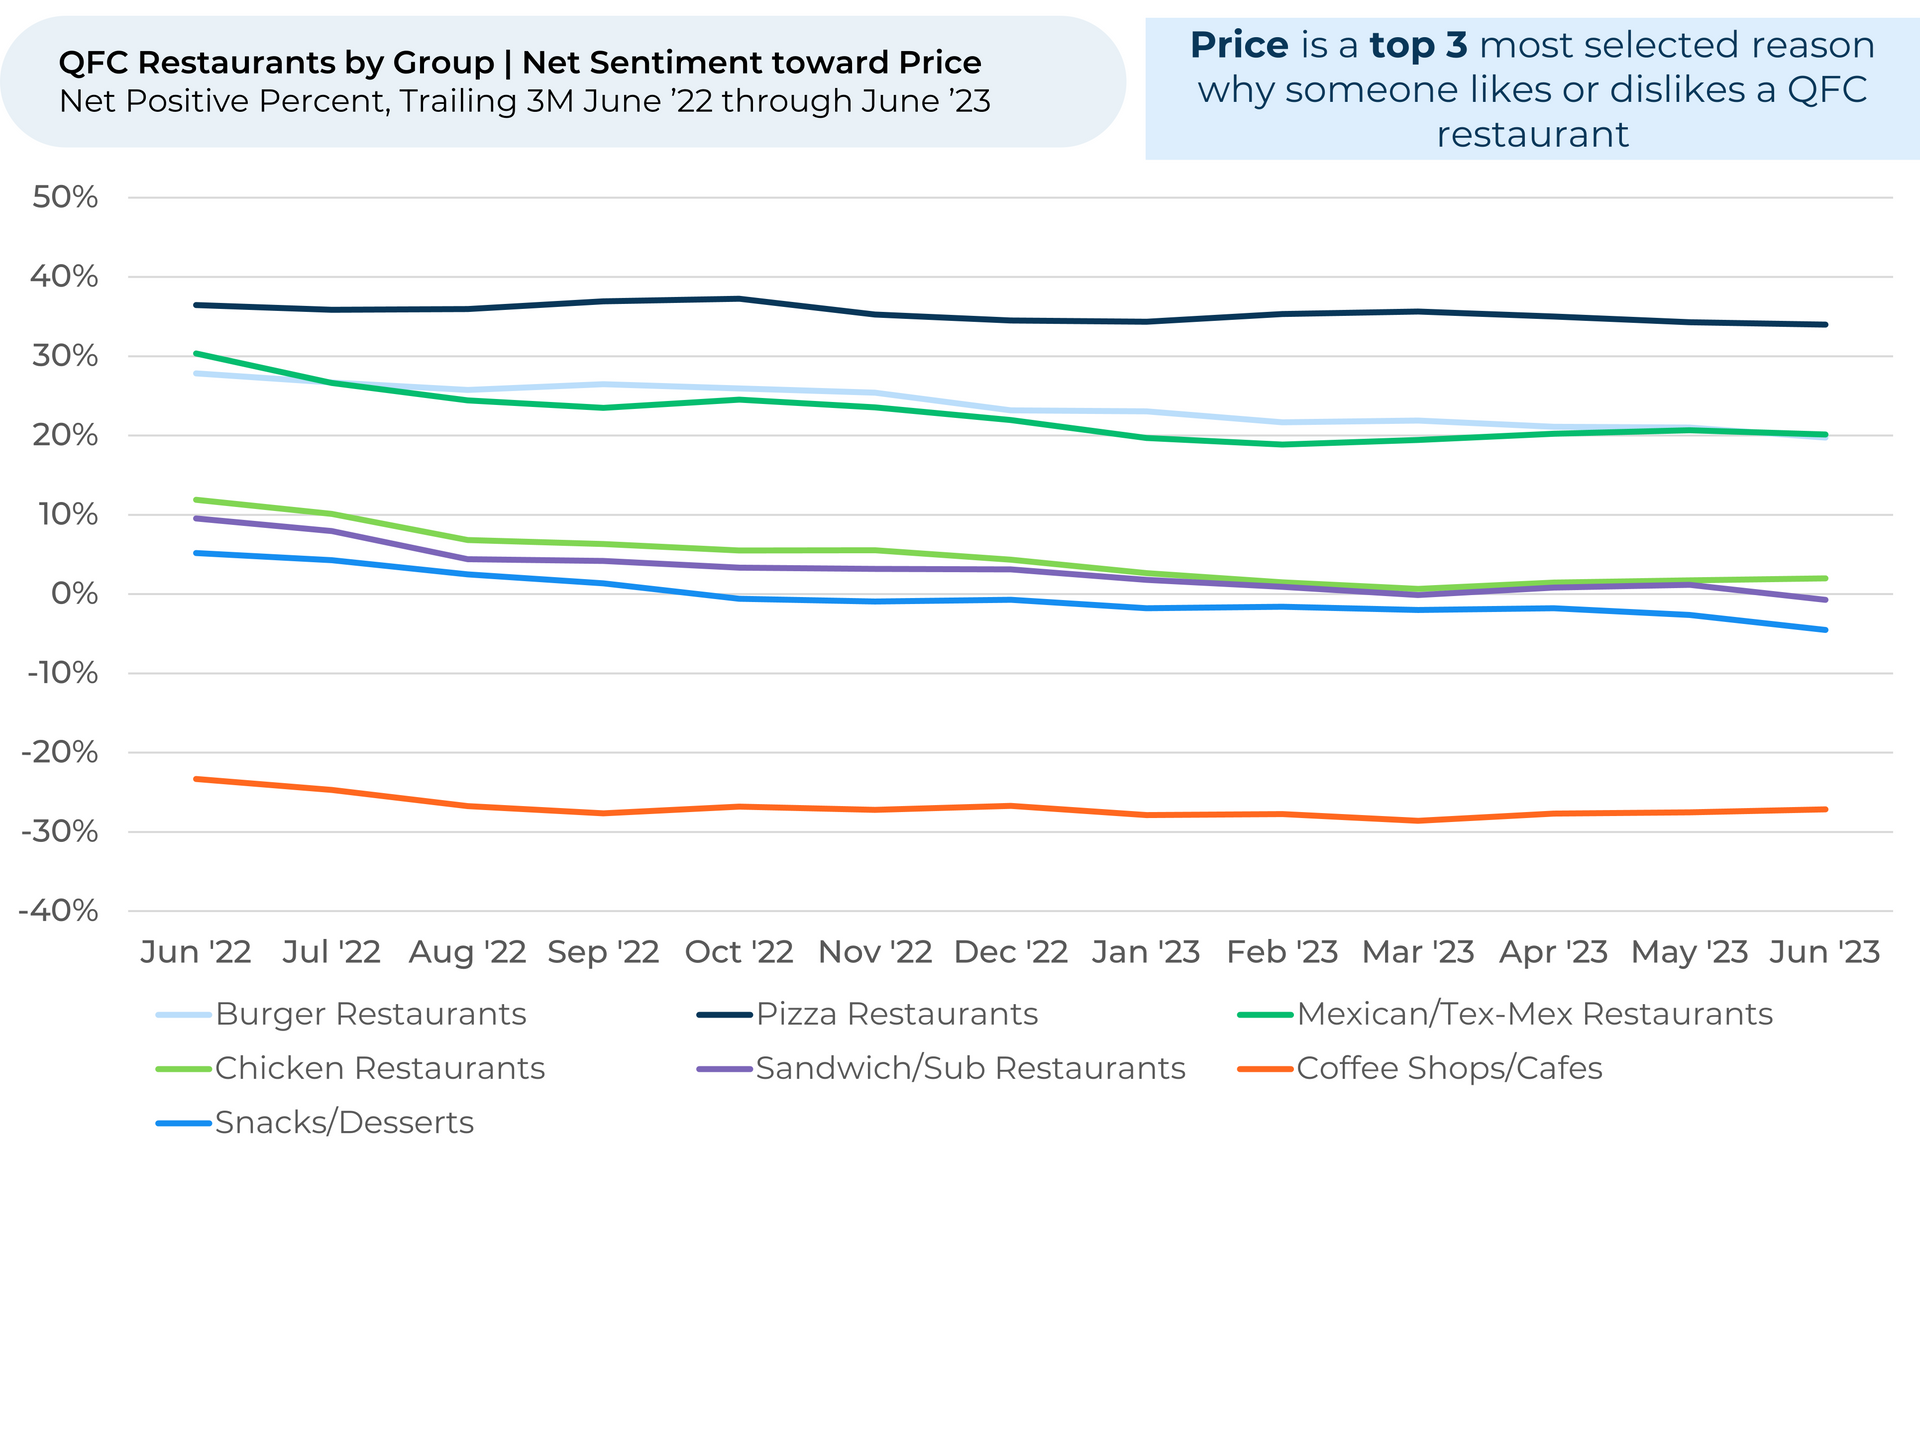
  • However, customers have soured on QFC restaurant prices. Net sentiment3 toward Price fell 1% over the past three months and 7% over the past year, more than any other food-related industry. This corresponds with a relatively high inflation rate for fast-food restaurants.  
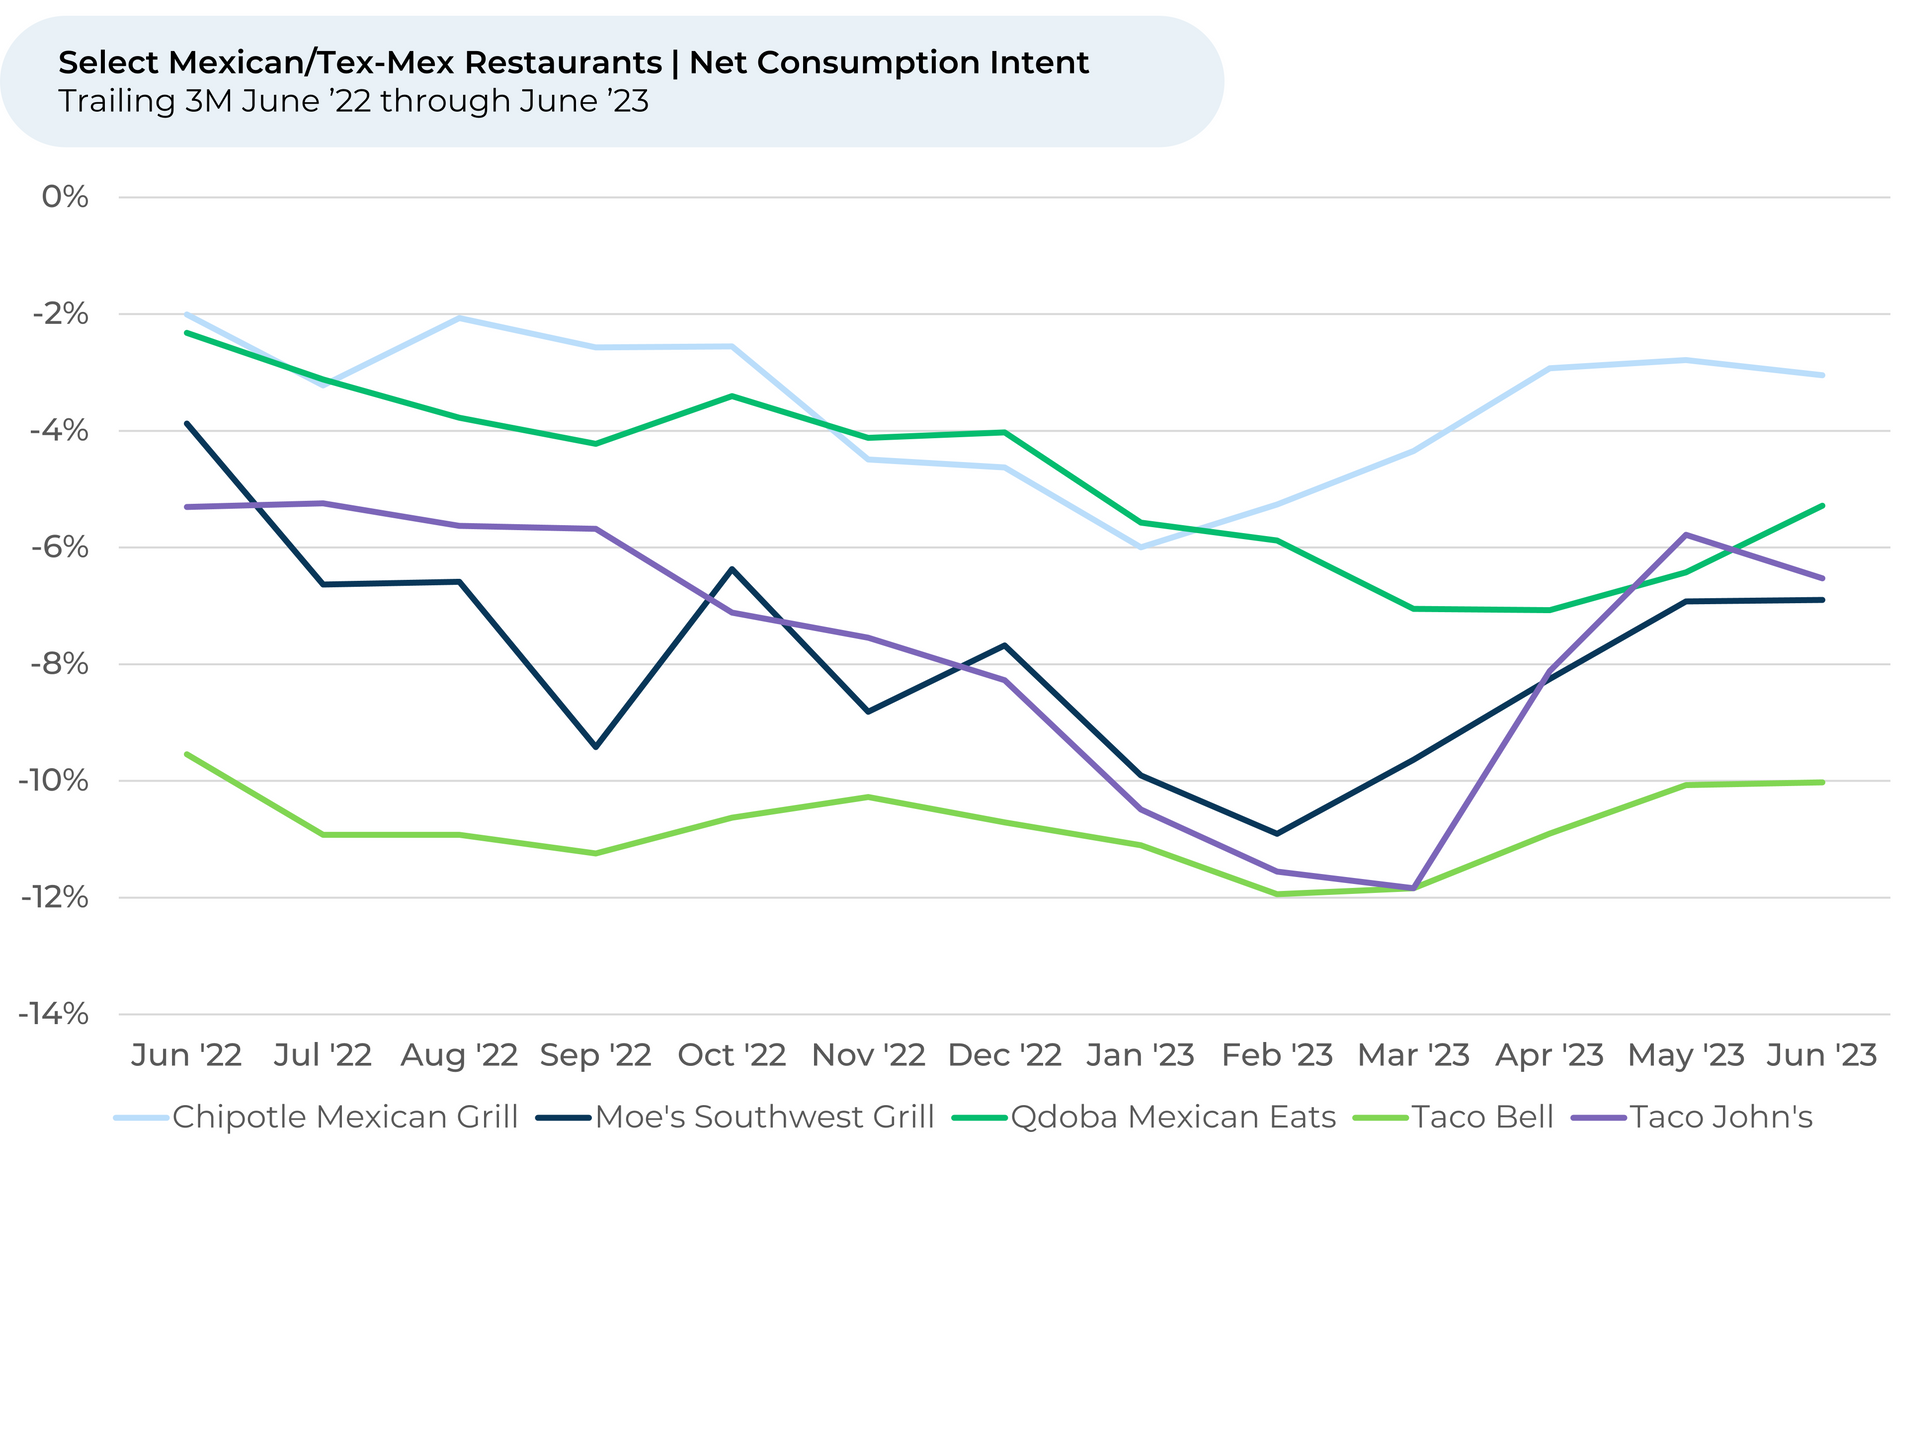
  • Grouping QFC restaurants by the types of food they serve, we find Mexican/Tex-Mex restaurants are positioned to gain share of stomach. Consumption Intent grew 2% over the past three months, narrowing the gap with chicken, coffee shops and sandwiches, which were flat to down 1%.
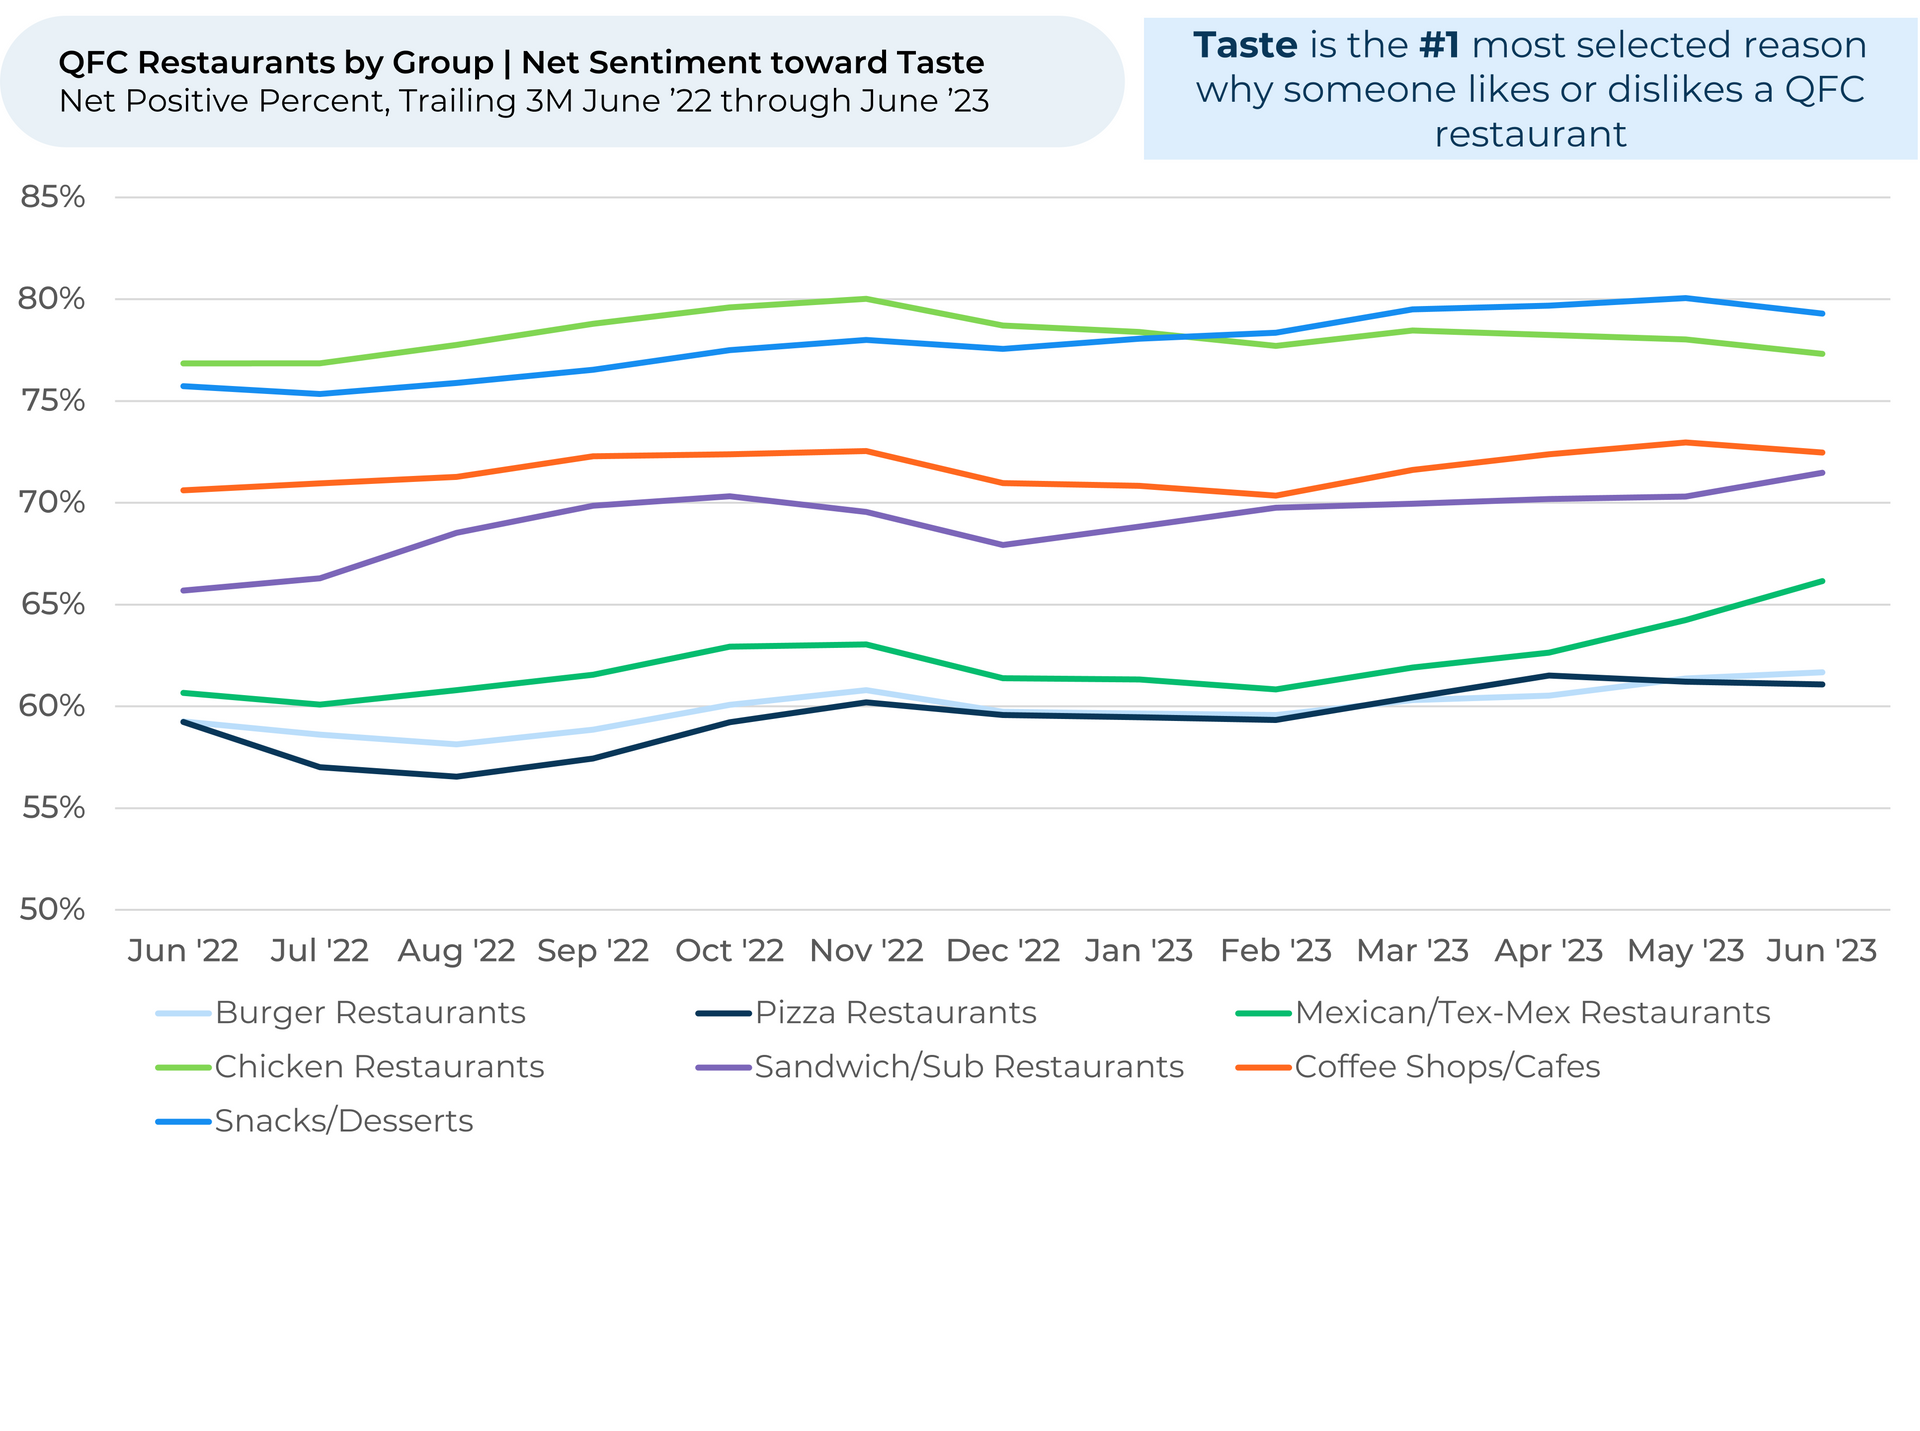
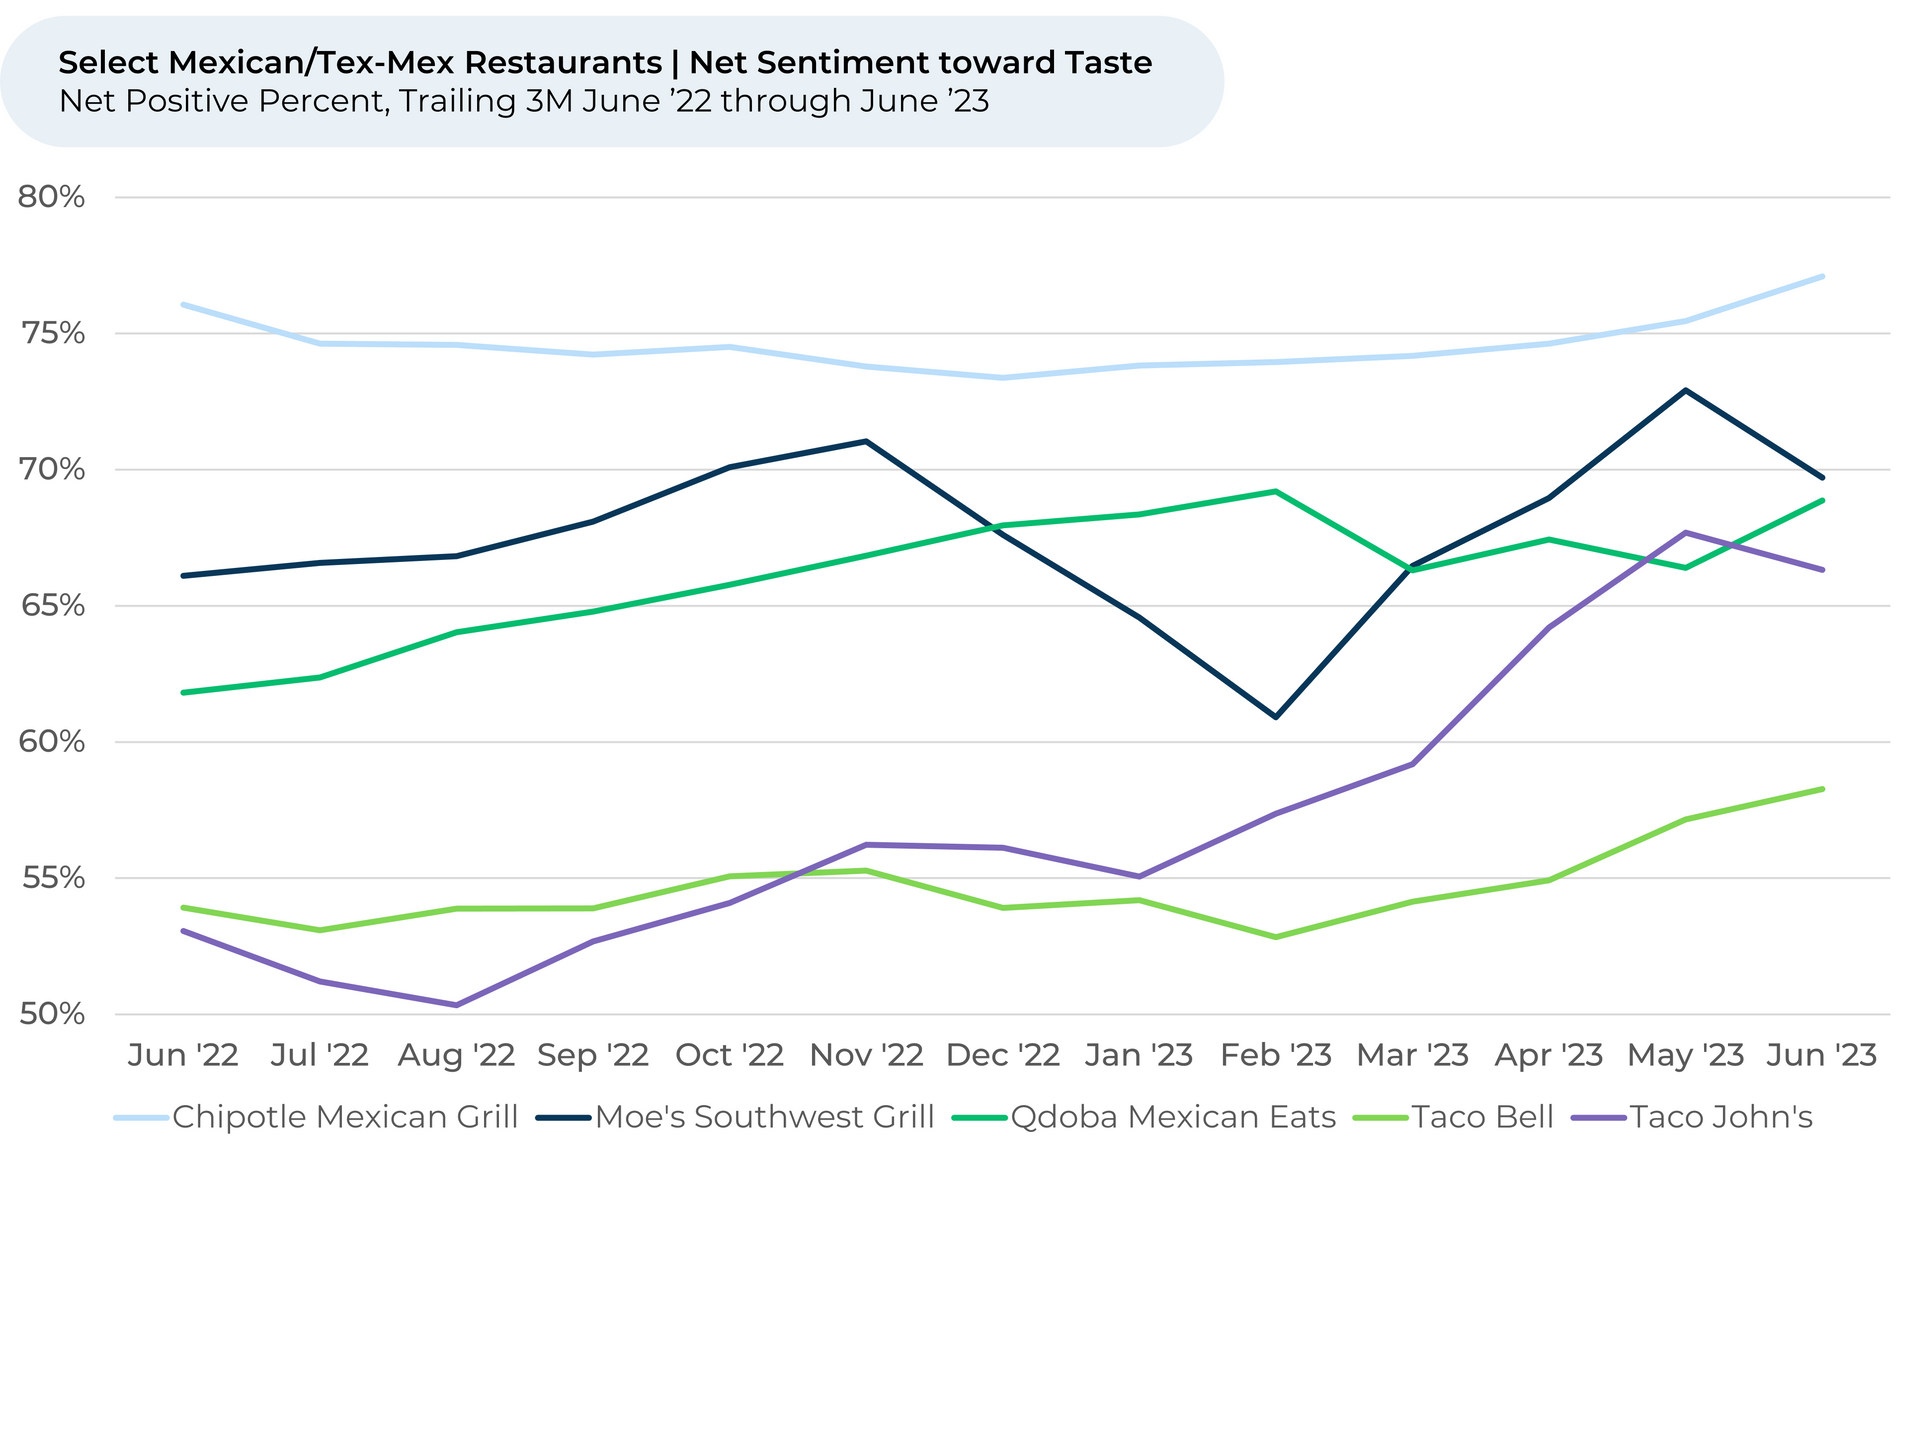
  • The future growth in Mexican/Tex-Mex restaurants appears to be driven primarily by taste, followed by price. However, customers say snack/dessert chains and fast food chicken restaurants still taste the best.
  • Taco John’s, despite its legal issues with Taco Bell, is gaining the most customer appeal. It seems eaters are responding well to its new/renewed menu items. Still, Mexican/Tex-Mex eaters say Chipotle tastes the best. 


Discover HundredX insights into QFC Restaurant Trends:


  • Slide title

    Write your caption here
    Button
  • Slide title

    Over the past three months, Consumption Intent stayed pretty stable for most food-related industries, including Quick, Fast, Casual (QFC) restaurants.  It dropped modestly for Meal Kit Delivery Services (-2%) and Grocery (-1%).​

    Button
  • Slide title

    Net sentiment toward Price didn’t move much for food industries, although it did drop (-1%) for QFC restaurants over the past three months. It fell 7% for the group over the past year, more than any other food industry. ​

    Button
  • Slide title

    Over the past three months, Consumption Intent is up the most (+2%) for Mexican/Tex-Mex Restaurants. It remained within a tight range for other types of QFC restaurants, with a 1% dip for Sandwich/Sub Restaurants. Mexican/Tex-Mex Restaurants future growth can at least partly be explained by…..​

    Button
  • Slide title

    … a jump in net sentiment toward Taste (+4%) since March. The increase is the highest among types of QFC restaurants. Chicken Restaurants fell the most (-1%). The jump for Mexican is driven by Chipotle (new Chicken al Pastor items) and Taco Bell (new steak and double taco items, return of the Enchirito and popular frozen drinks)​

    Button
  • Slide title

    Net sentiment toward Price also increased modestly for Mexican/Tex-Mex Restaurants since March (+1%), alongside Chicken Restaurants (1%) and Coffee Shops/Cafes (1%) . It fell 1%-3% for the other restaurant types. ​

    Button
  • Slide title

    Looking at some of the top Mexican/Tex-Mex brands, we find that Consumption Intent since March increased the most for Taco John’s (+5%), although it grew for all the major Mexican/Tex-Mex brands. Moe’s Southwest Grill is the second biggest gainer (+3%).​

    Button
  • Slide title

    Taco John’s future Consumption Intent pickup seems driven by its taste. Over the past three months, net sentiment toward Taste improved for the top Mexican/Tex-Mex QFC restaurants, but it improved the most of Taco John’s (+7%) and Taco Bell (+4%). Taco John’s released a few new items, including Queso Fried Chicken Tacos and Mango Shrimp Street Tacos. ​

    Button
  • Slide title

    Write your caption here
    Button

Please contact our team for a deeper look at HundredX's QFC data, which includes more than 900,000 pieces of customer feedback across over 180 restaurant brands.


  1. Consumption Intent reflects a way to compare the future intentions of customers across various food-related industries. It captures:
  2. Loyalty Intent for Meal Kit Delivery Services, which is the percentage of customers who plan to keep using the service minus the percentage who intend to cancel. It also captures Visit Intent for Groceries, Usage Intent for Food Delivery, and Purchase Intent for the dining industries, which all represent the percentage of customers who expect to visit, use or spend more on a brand minus those who intend to visit, use or spend less.
  3. We find businesses that see customer Intent trends gain versus the industry have often seen revenue growth rates, margins and/or market share also improve versus peers.
  4. All metrics presented, including Net Usage Intent (Usage Intent), and Net Positive Percent / Net Sentiment are presented on a trailing three-month basis unless otherwise noted.
  5. HundredX measures sentiment towards a driver of customer satisfaction as Net Positive Percent (NPP), which is the percentage of customers who view a factor as a positive (reason they liked the products, people, or experiences) minus the percentage who see the same factor as a negative.

Strategy Made Smarter


HundredX works with a variety of companies and their investors to answer some of the most important strategy questions in business:

  • Where are customers "migrating"?
  • What are they saying they will use more of in the next 12 months?
  • What are the key drivers of their purchase decisions and financial outcomes?


Current clients see immediate benefits across multiple areas including strategy, finance, operations, pricing, investing, and marketing.


Our insights enable business leaders to define and identify specific drivers and decisions enabling them to grow their market share.


Please contact our team to learn more about which businesses across 75 industries are best positioned with customers and the decisions you can make to grow your brand’s market share.

####


HundredX is a mission-based data and insights provider. HundredX does not make investment recommendations. However, we believe in the wisdom of the crowd to inform the outlook for businesses and industries. For more info on specific drivers of customer satisfaction, other companies within 75+ other industries we cover, or if you'd like to learn more about using Data for Good, please reach out: https://hundredx.com/contact.

Share This Article

06 May, 2024
Sure, lattes, mochaccinos, and cappuccinos are pricey, but they taste delicious. For many consumers, the great taste of coffee shop coffee made it worth the cost. But customers at Starbucks aren't so sure the tradeoff is worth it anymore. Examining more than 420,000 pieces of feedback across the Quick, Fast, Casual (QFC) industry, including over 21,000 on Starbucks, we find: Starbuck's Purchase Intent 1,2 is down 3% over the past six months, with most of that dip occurring over the past few months. By contrast, Dunkin' Donuts has remained within a tight range over the past six months, as did an average of other, smaller coffee chains. Customers increasingly see less value in Starbucks. Starbuck's Value perception 3 fell 5% over the past six months, compared to just 1% for Dunkin' Donuts. However, it also fell 5% for the average of the smaller coffee chains. Coffee drinkers feel significantly unhappier about Starbuck's quality and taste. Starbuck's Taste perception fell 4% over the past six months, while rising 1% for competitors. Likewise, its Quality perception dipped 3% over the same time period (and 8% over the year). Ultimately, Starbuck's perceived drop in taste is leading inflation-weary consumers to say they plan to spend less at the coffee chain, as the value just isn't as good.
06 May, 2024
Forbes Best Brands for Social Impact, Powered by HundredX
06 May, 2024
Ozempic once dominated the headlines, but GLP-1 competitor Mounjaro is winning over customers. GLP-1 drugs, used for treating diabetes and aiding in weight loss, are relatively new on the market yet have surged in popularity over the last year. They're becoming so popular that J.P. Morgan estimates that 30 million people in the US may be using a GLP-1 drug by 2030. This statistic presents a significant potential for early drug creator Novo Nordisk (Ozempic, Wegovy), and perhaps an even bigger one for Eli Lilly (Mounjaro, Zepbound). HundredX data indicates Eli Lilly is in a position to win over Novo Nordisk as Mounjaro's Usage Intent widens against the competition. Ozempic may have name recognition, but customers feel more positively about Mounjaro's effectiveness and lifestyle impact, even if they aren't excited about its high price. Examining 1,500 pieces of customer feedback across Mounjaro, Ozempic, and Wegovy, we find: GLP-1 users increasingly say they plan to use Mounjaro more, and Ozempic less . Mounjaro’s Usage Intent is up 19% since July, Wegovy’s is up 3%, and Ozempic has stayed within a tight range. Customers feel Mounjaro is more effective than competing drugs, but it’s harder to get . Mounjaro outperforms other GLP-1 drugs in effectiveness, lifestyle impact, and side effects. However, customers dislike its cost and availably more than competitors.
Share by: