Unlocking the magic of 55,000 theme park visitor feedback!


While many observers believe Disney theme parks are suffering from a slowdown in attendance, we see price cuts reviving interest in visiting and recent attendees feeling better about wait times.


Analyzing 55,000 pieces of feedback from “The Crowd” of theme park visitors, including more than 20,000 from across Disney’s parks, from July 2022 through July 2023, we find:

Key Takeaways

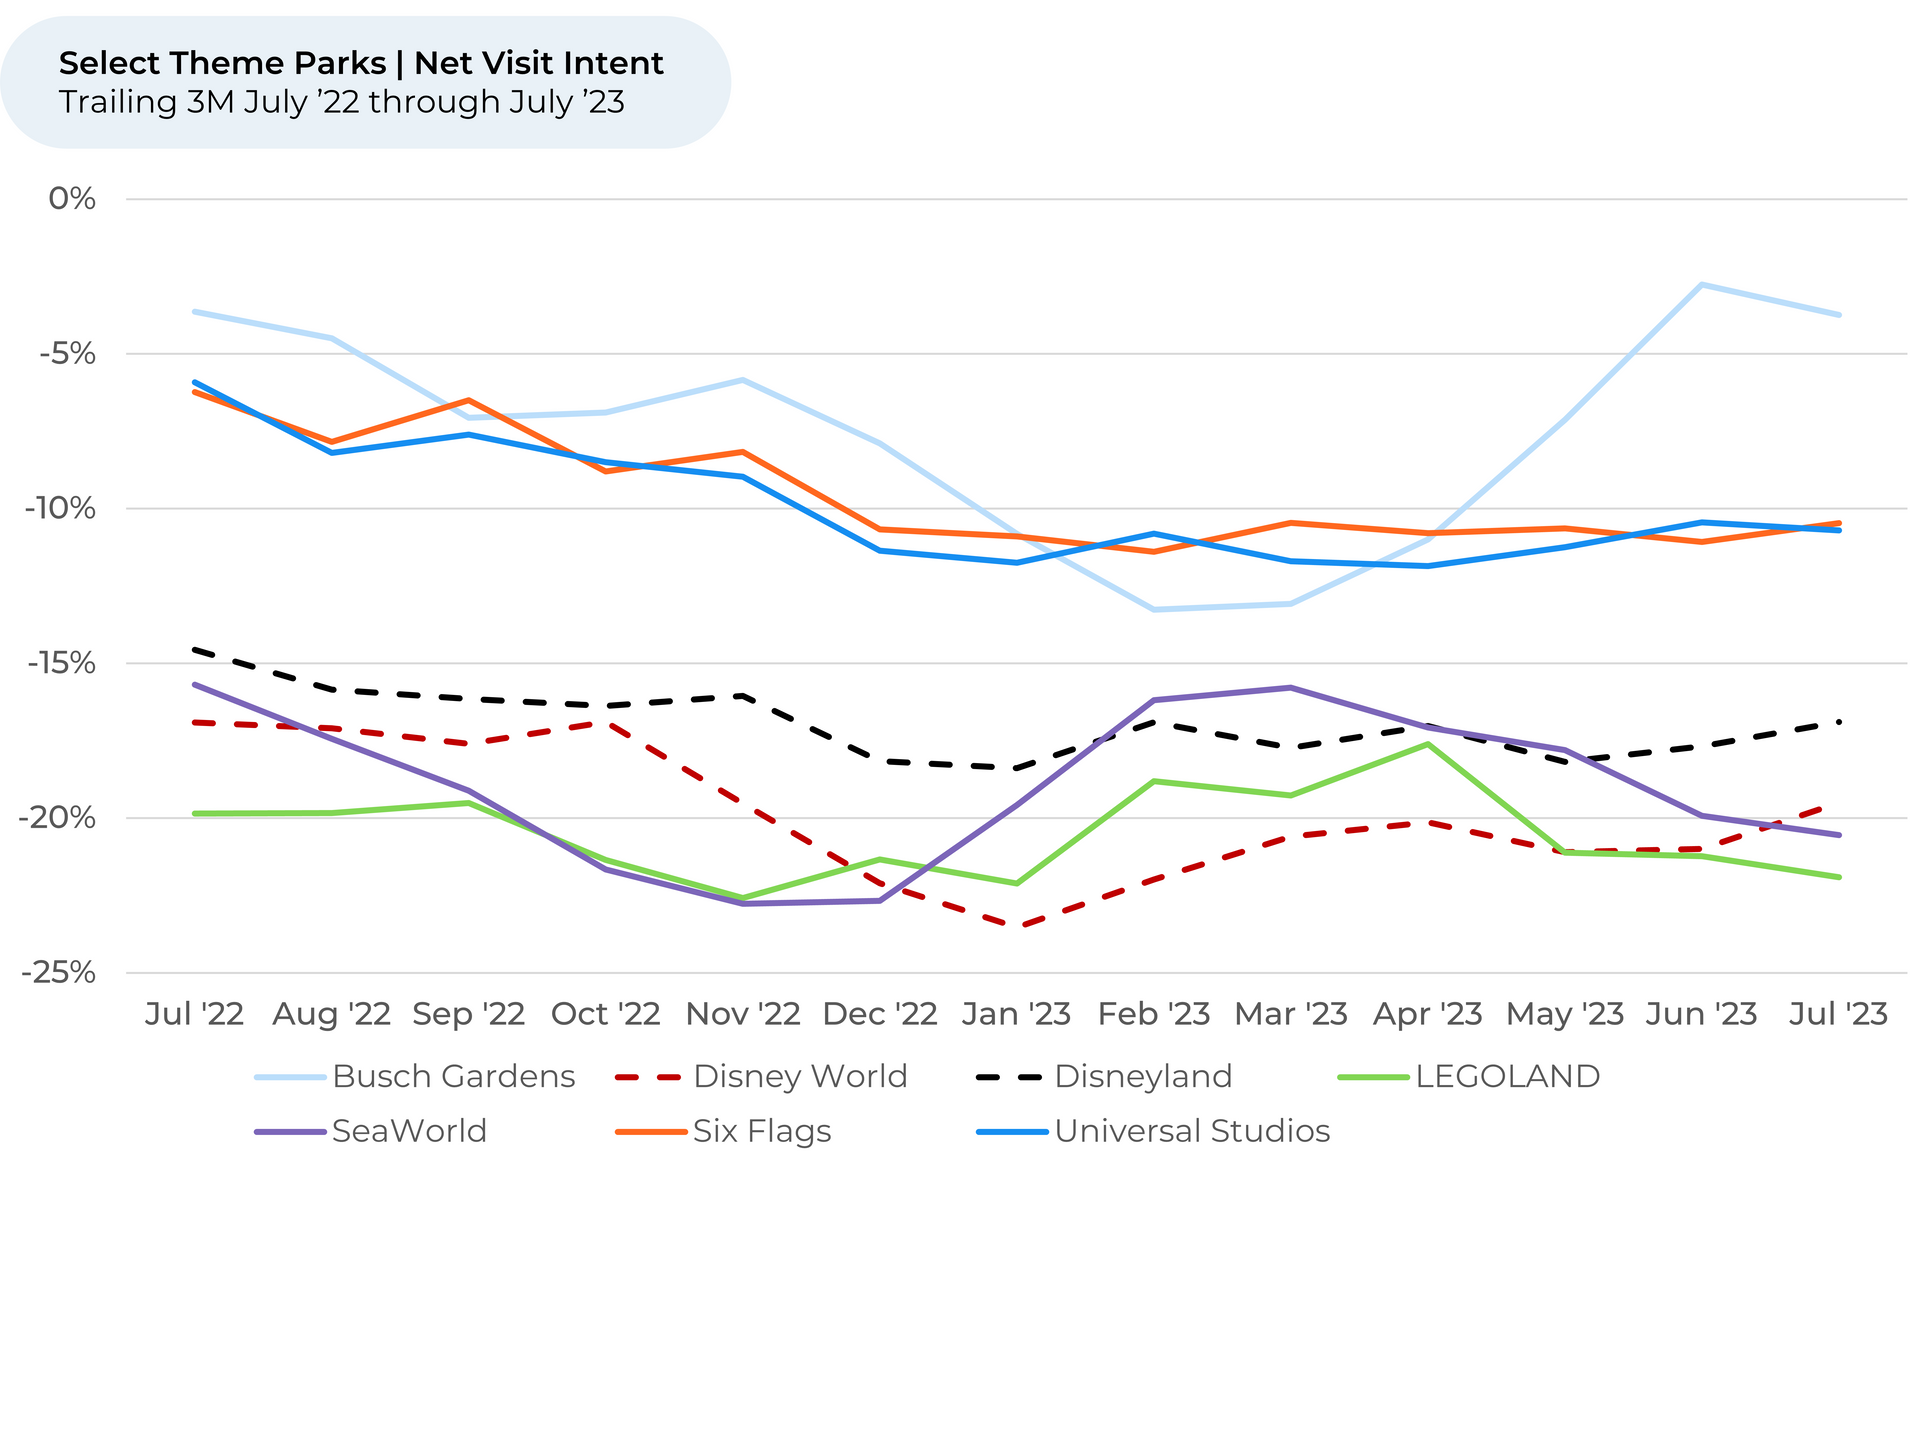
  • July Visit Intent1,2 for Disney parks is down 2% compared to last July, but up 1% vs. a month and three months ago. Given debate about how much Disney attendance will suffer from January price hikes, Disney’s recent Visit Intent trends being better than the rest of the industry is a positive sign for its relative growth outlook. Visit intent for other theme parks we follow was flat vs. three months ago and down 4% from a year ago.
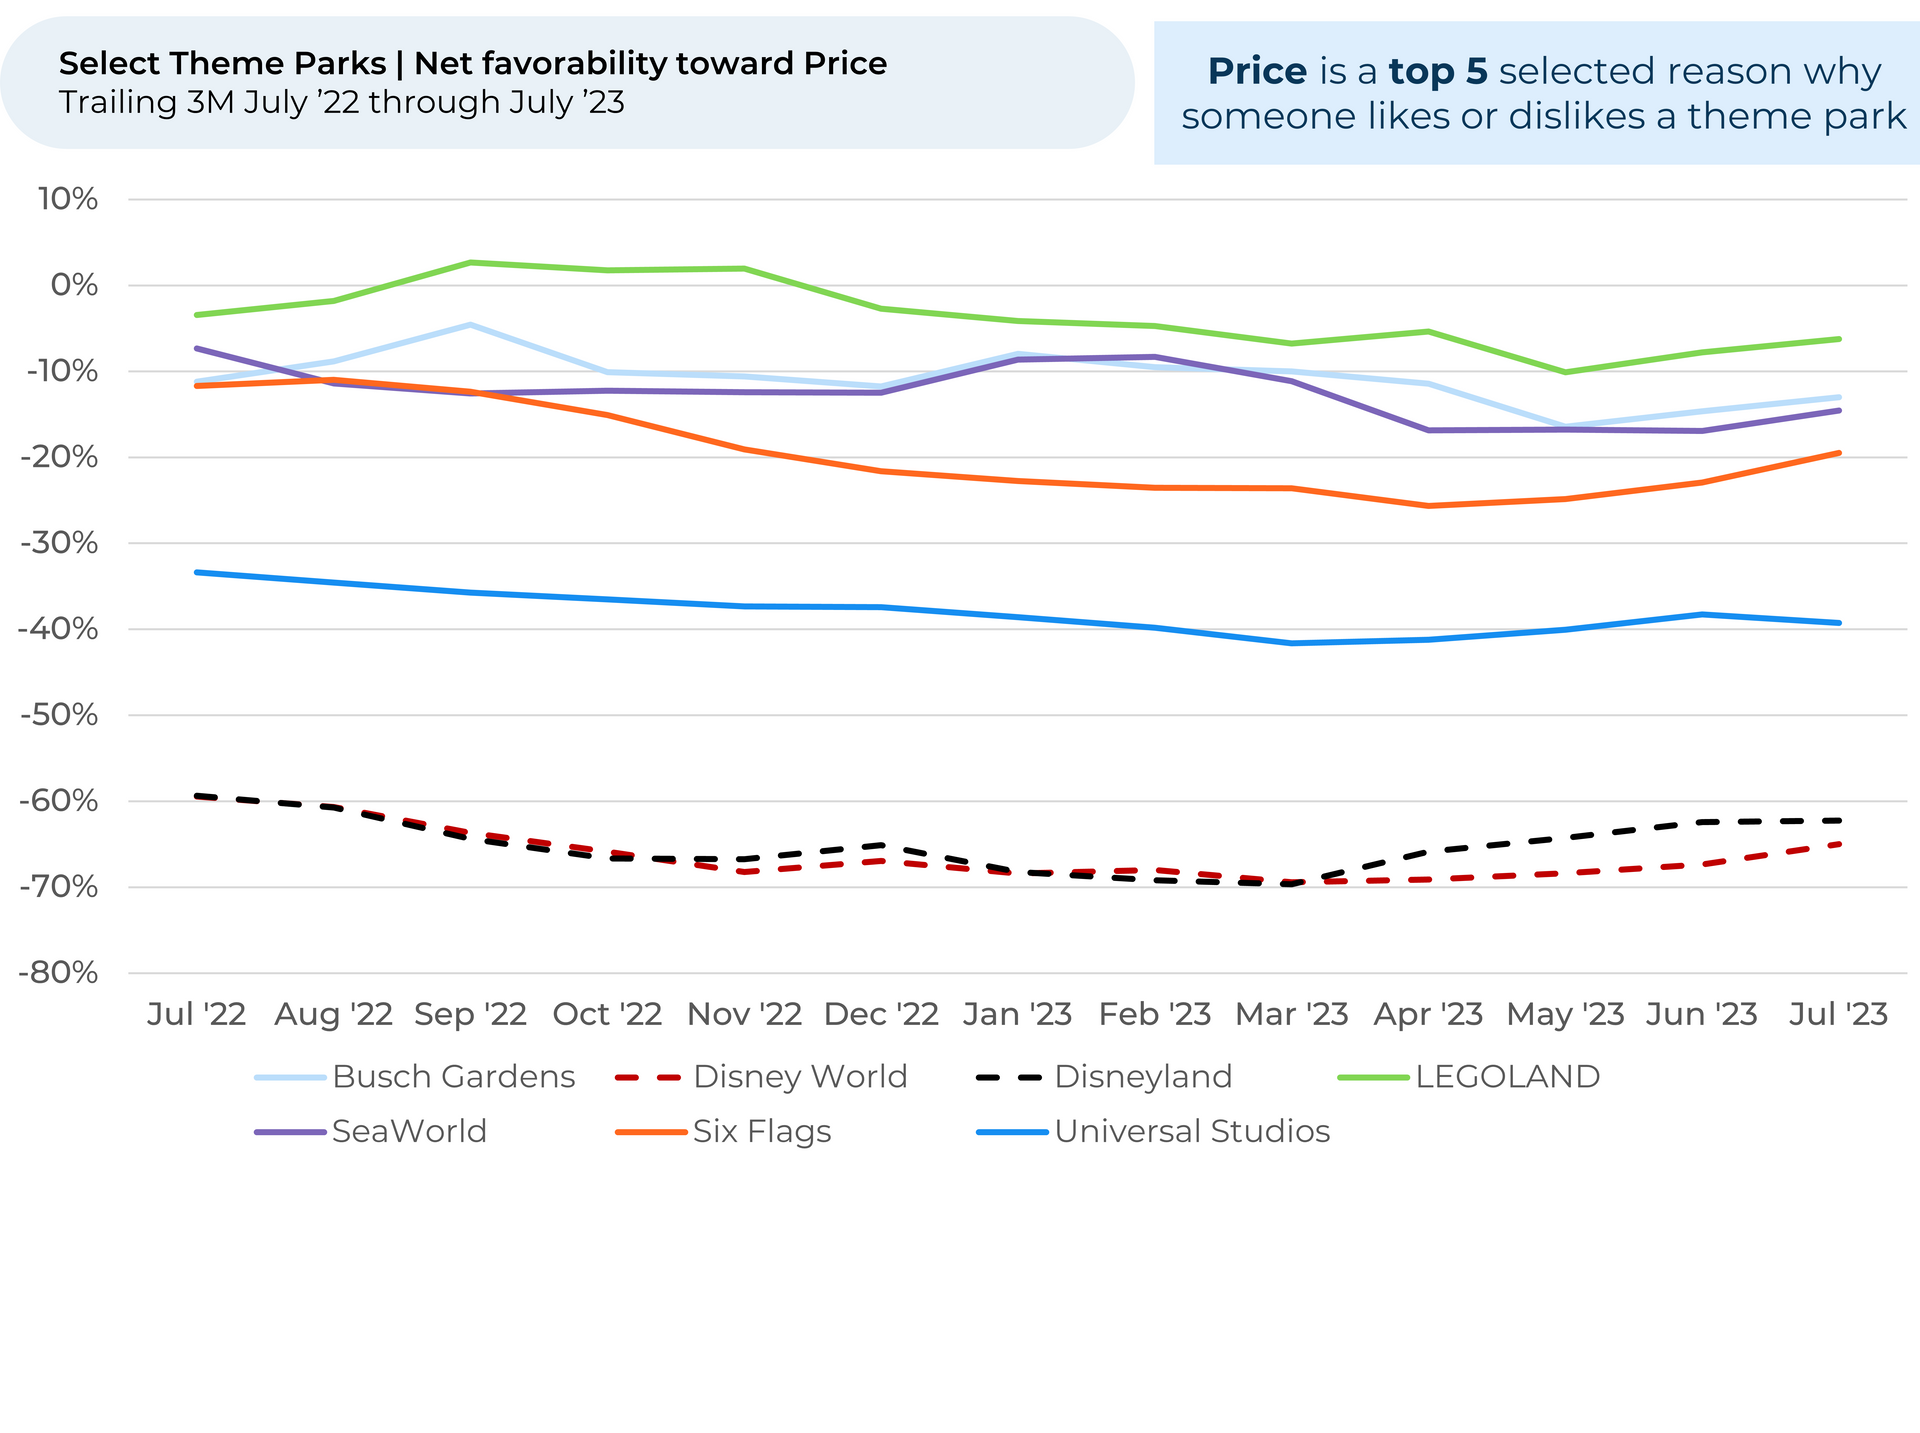
  • Disney’s new holiday price cuts seem to be helping future attendance. Disney parks have cut Christmas ticket prices, which seems to be pleasing customers. In addition to an increase in Visit Intent, net favorability toward Disney parks’ Prices improved 2% in July vs. June.
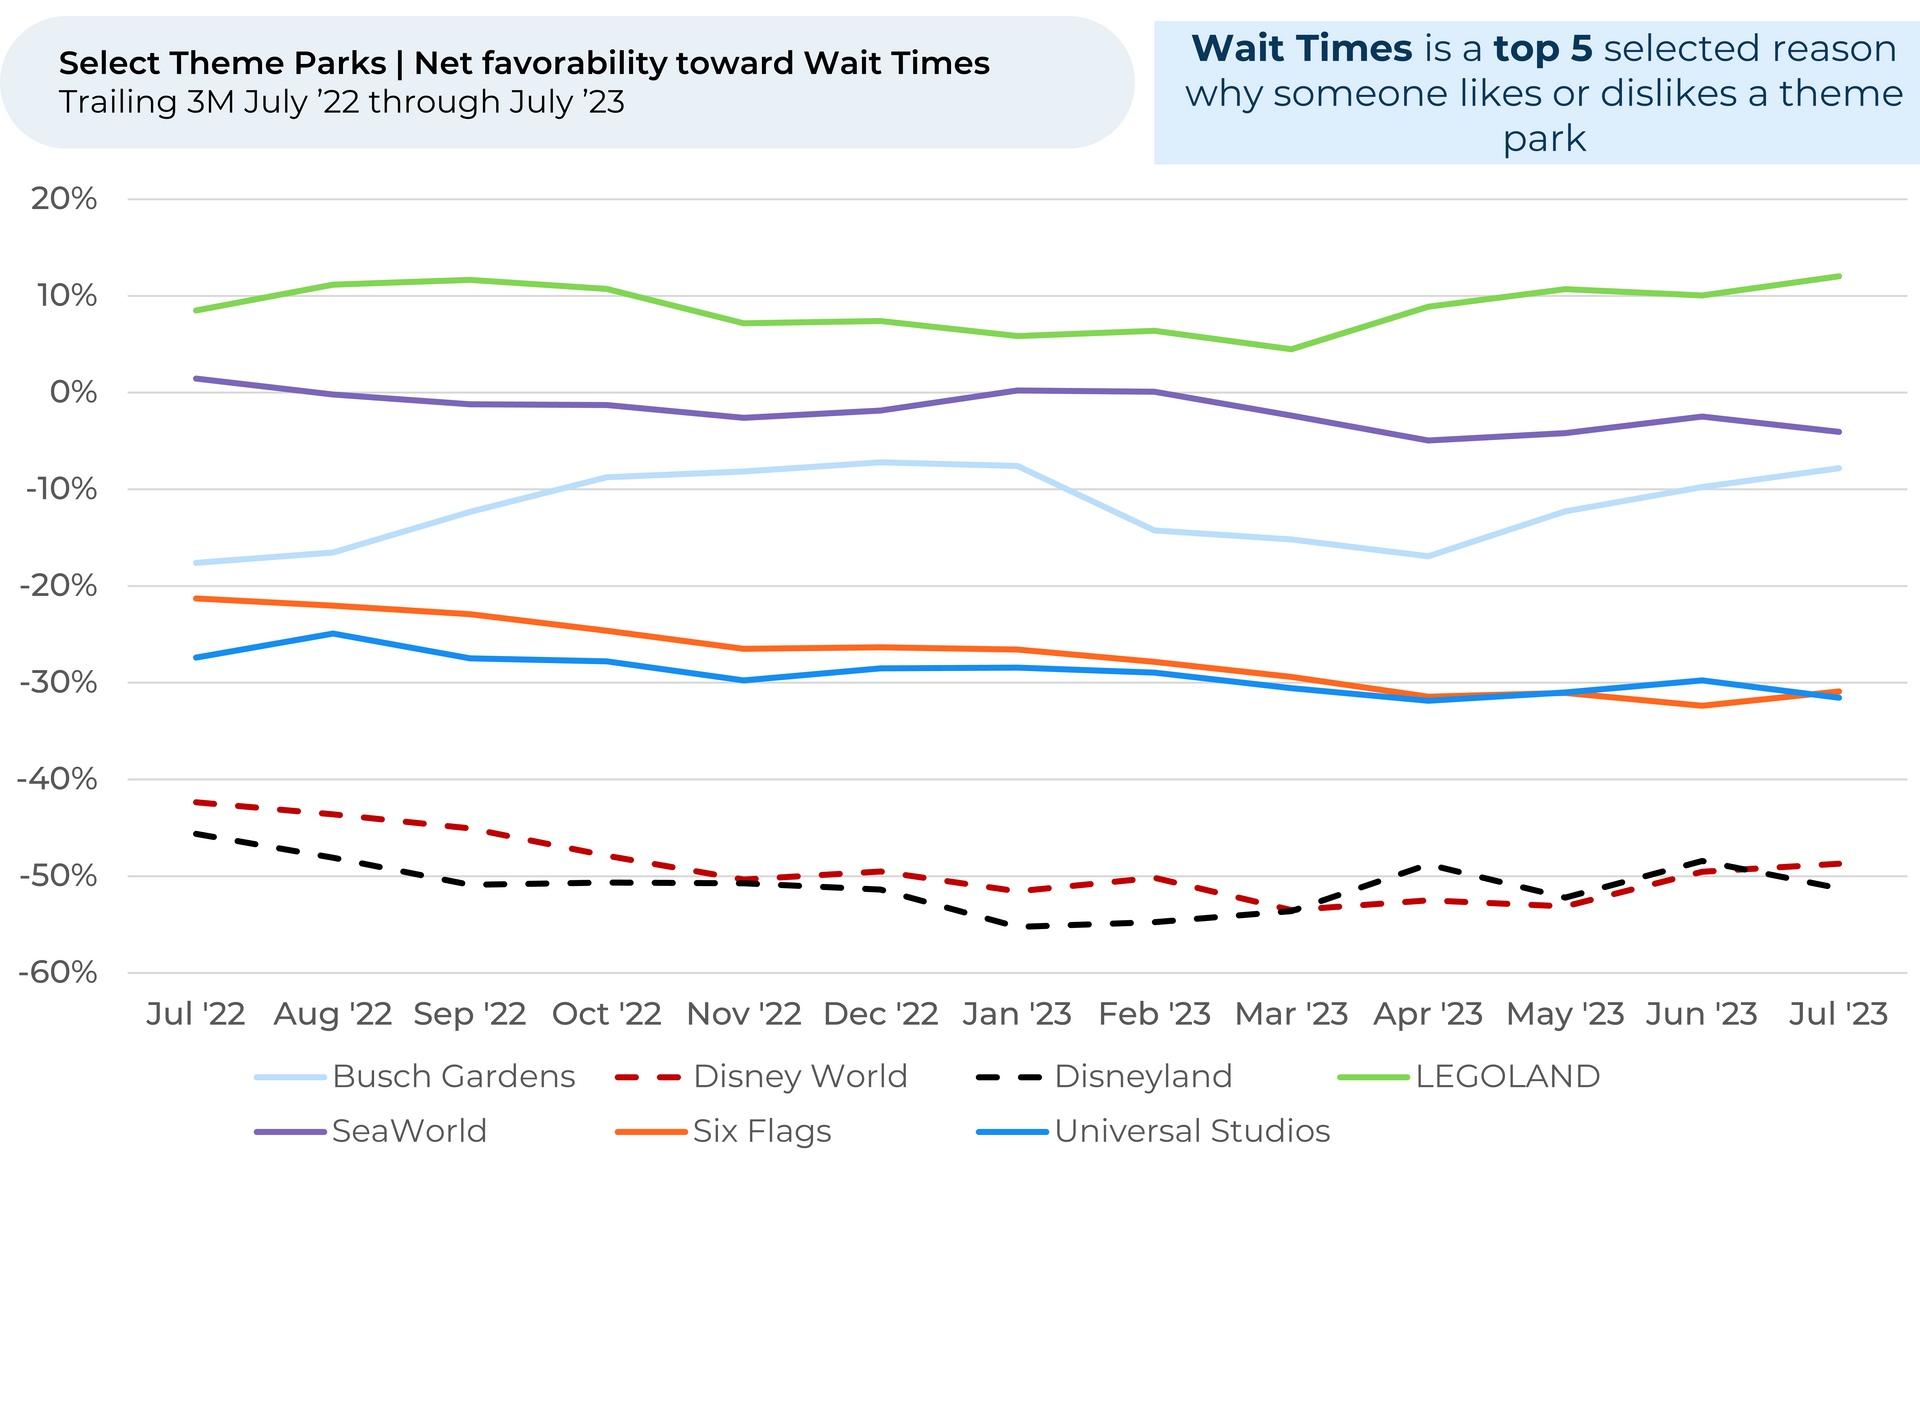
  • Customers have been feeling happier about ride wait times, indicating that wait times have likely come down. The Wall Street Journal recently reported that shorter wait times and greater discounts are indicating lower attendance. Net favorability3 towards wait times for Disney World rose 4% the last three months, but at -50% it is still way behind the -18% average for other parks ex. Disney.
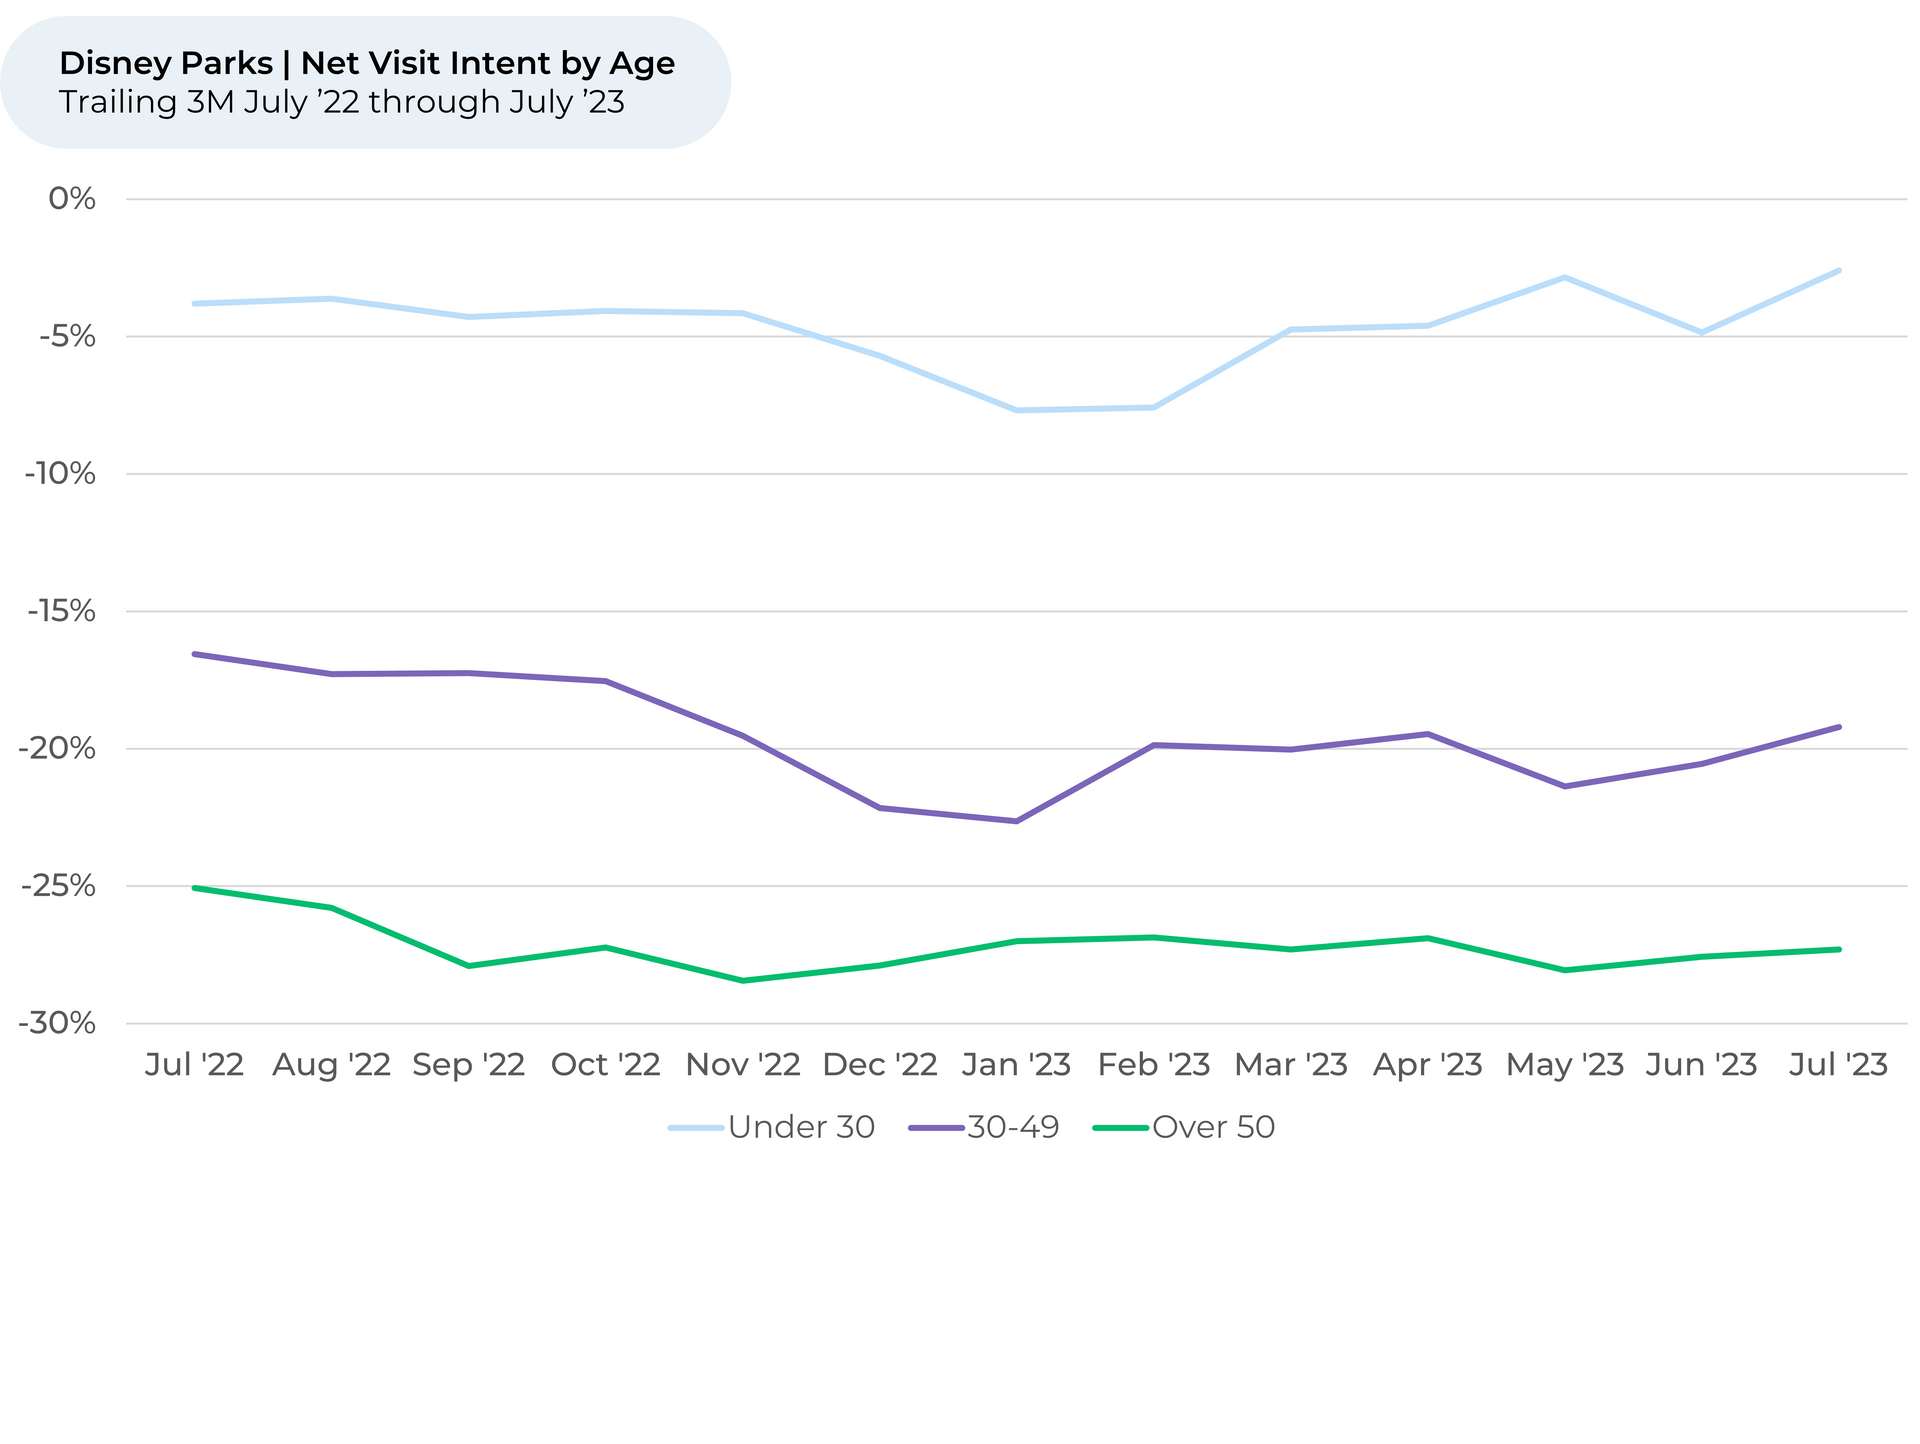
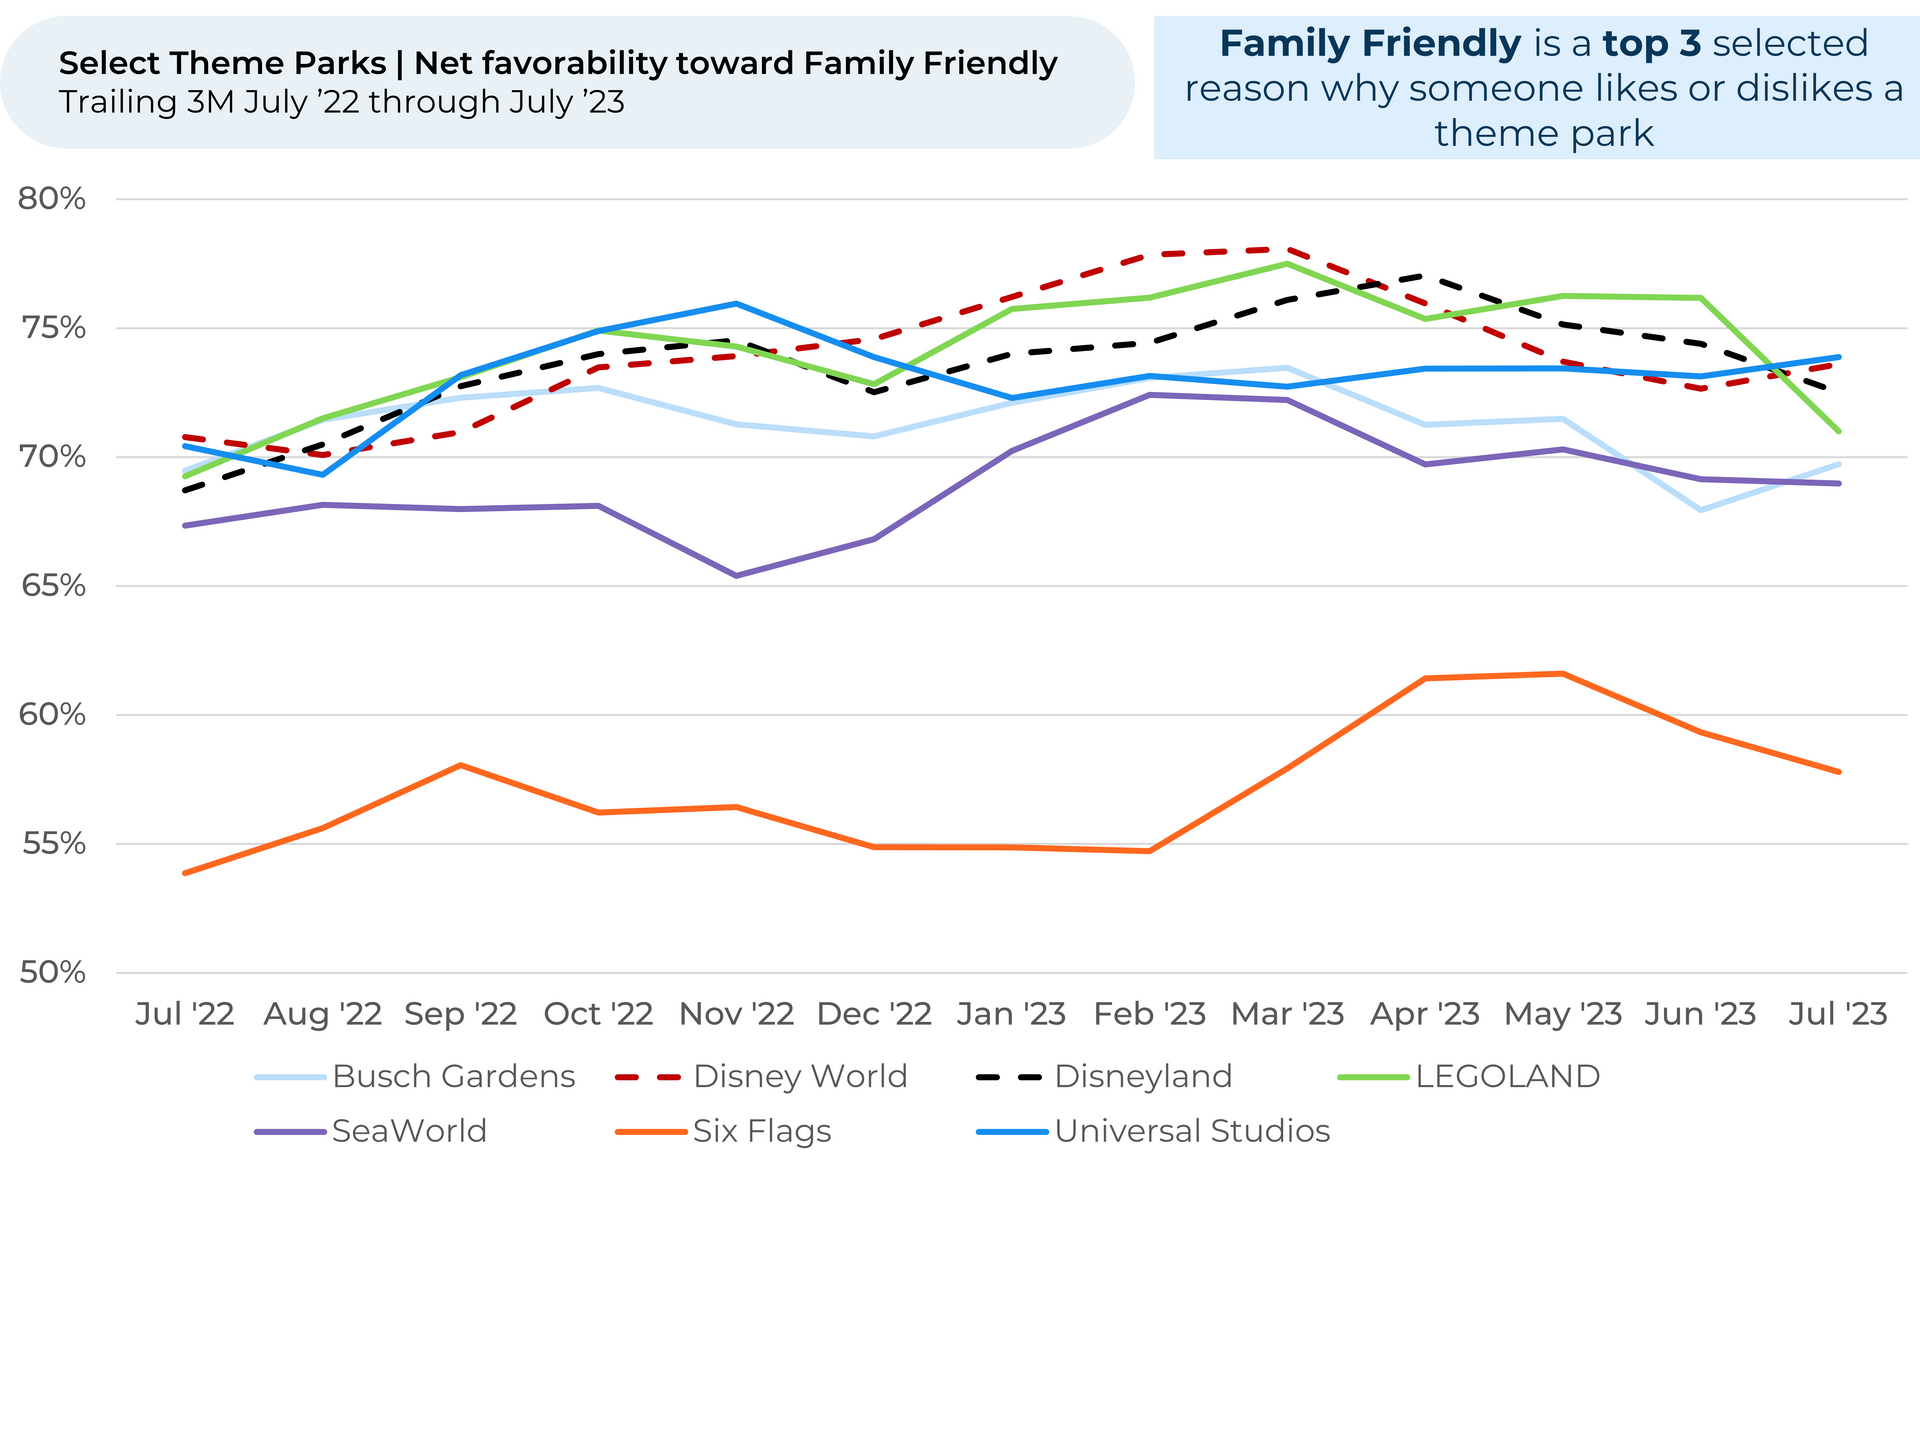
  • Disney’s feud with Florida political leadership seems to be hurting how many families with young children feel about the parks. Visit Intent dropped the most over the last year with visitors in their 30s and 40s, corresponding with a drop in net favorability3 toward “Family Friendly”. Both declines align with escalations in Disney’s feud that started in March 2022. Visit Intent is actually up with customers under 30 since last year.


Discover HundredX insights into Theme Park Trends:

  • Slide title

    Write your caption here
    Button
  • Slide title

    Compared to this time last year, Visit Intent is down for Disney World (-3%) and Disneyland (-2%). But, both Disney parks have picked up in recent months. Trends in Visit Intent have mirrored CEO Bob Iger’s recent comments, where he told CNBC that Disney parks saw a post-COVID boost in attendance in 2022 that has naturally slipped in 2023. Better recent visit intent trends vs. the industry are a positive sign for Disney’s relative growth outlook.  ​

    Button
  • Slide title

    The Wall Street Journal reported that Disney World ride wait times on July 4, 2023 were lower than they had been in recent years. Our data seems to confirm wait times have down. Over the past three months, Disney World customers felt notably happier (+4% net favorability) about the wait times for rides and attractions. ​

    Button
  • Slide title

    Over the past three months, net favorability toward Price increased for both Disney parks by 4%. Disney has lowered prices in recent months in a bid to increase attendance. The move does seem to be working, given the recent increase in Disney parks’ Visit Intent. ​

    Button
  • Slide title

    While ride wait times are down, visitors may not be as interested in going on them. Net favorability toward Rides dropped for Disney World (-5%) and Disneyland (-4%) from a peak in October to a low in June. While net favorability appears to have bounced from a bottom in June, it still has a ways to go. Disney World closed its long-standing Splash Mountain ride in January 2023, with Disneyland following suit in May. The parks plan on opening a new Princess and the Frog version of the ride in 2024.​

    Button
  • Slide title

    Interestingly, Visit Intent dropped the most for Disney parks versus last summer for visitors in their 30s and 40s (-3%) and visitors over 50 (-2%). It actually increased for young adults under 30 (1%). Visit Intent is starting to pick back up, however, for all age groups​

    Button
  • Slide title

    The Visit Intent dip with middle-aged customers – those most likely to be visiting with young children – seems linked to a drop in net favorability toward Family Friendly. It appears favorability toward Family Friendly fell in 2022 amid Disney’s feud with Florida’s political leadership. That feud took center stage again in April, after Disney sued Florida governor Ron DeSantis.​

    Button

Please contact our team for a deeper look at HundredX's theme park data, which includes 130,000 pieces of customer feedback across over 14 theme park brands (including over 50,000 on Disney parks).


  1. All metrics presented, including Net Usage Intent (Usage Intent), and Net Positive Percent / Net Favorability are presented on a trailing three-month basis unless otherwise noted.
  2. Visit Intent reflects the percentage of customers who plan to visit a specific brand more during the next 12 months, minus the percentage who plan to visit less. We find businesses that see customer Intent trends gain versus the industry have often seen revenue growth rates, margins and/or market share also improve versus peers.
  3. HundredX measures Net Favorability towards a driver of customer satisfaction as Net Positive Percent (NPP), which is the percentage of customers who view a factor as a positive (reason they liked the products, people, or experiences) minus the percentage who see the same factor as a negative.

Strategy Made Smarter


HundredX works with a variety of companies and their investors to answer some of the most important strategy questions in business:

  • Where are customers "migrating"?
  • What are they saying they will use more of in the next 12 months?
  • What are the key drivers of their purchase decisions and financial outcomes?


Current clients see immediate benefits across multiple areas including strategy, finance, operations, pricing, investing, and marketing.


Our insights enable business leaders to define and identify specific drivers and decisions enabling them to grow their market share.


Please contact our team to learn more about which businesses across 75 industries are best positioned with customers and the decisions you can make to grow your brand’s market share.

####


HundredX is a mission-based data and insights provider. HundredX does not make investment recommendations. However, we believe in the wisdom of the crowd to inform the outlook for businesses and industries. For more info on specific drivers of customer satisfaction, other companies within 75+ other industries we cover, or if you'd like to learn more about using Data for Good, please reach out: https://hundredx.com/contact.

Share This Article

06 May, 2024
Sure, lattes, mochaccinos, and cappuccinos are pricey, but they taste delicious. For many consumers, the great taste of coffee shop coffee made it worth the cost. But customers at Starbucks aren't so sure the tradeoff is worth it anymore. Examining more than 420,000 pieces of feedback across the Quick, Fast, Casual (QFC) industry, including over 21,000 on Starbucks, we find: Starbuck's Purchase Intent 1,2 is down 3% over the past six months, with most of that dip occurring over the past few months. By contrast, Dunkin' Donuts has remained within a tight range over the past six months, as did an average of other, smaller coffee chains. Customers increasingly see less value in Starbucks. Starbuck's Value perception 3 fell 5% over the past six months, compared to just 1% for Dunkin' Donuts. However, it also fell 5% for the average of the smaller coffee chains. Coffee drinkers feel significantly unhappier about Starbuck's quality and taste. Starbuck's Taste perception fell 4% over the past six months, while rising 1% for competitors. Likewise, its Quality perception dipped 3% over the same time period (and 8% over the year). Ultimately, Starbuck's perceived drop in taste is leading inflation-weary consumers to say they plan to spend less at the coffee chain, as the value just isn't as good.
06 May, 2024
Forbes Best Brands for Social Impact, Powered by HundredX
06 May, 2024
Ozempic once dominated the headlines, but GLP-1 competitor Mounjaro is winning over customers. GLP-1 drugs, used for treating diabetes and aiding in weight loss, are relatively new on the market yet have surged in popularity over the last year. They're becoming so popular that J.P. Morgan estimates that 30 million people in the US may be using a GLP-1 drug by 2030. This statistic presents a significant potential for early drug creator Novo Nordisk (Ozempic, Wegovy), and perhaps an even bigger one for Eli Lilly (Mounjaro, Zepbound). HundredX data indicates Eli Lilly is in a position to win over Novo Nordisk as Mounjaro's Usage Intent widens against the competition. Ozempic may have name recognition, but customers feel more positively about Mounjaro's effectiveness and lifestyle impact, even if they aren't excited about its high price. Examining 1,500 pieces of customer feedback across Mounjaro, Ozempic, and Wegovy, we find: GLP-1 users increasingly say they plan to use Mounjaro more, and Ozempic less . Mounjaro’s Usage Intent is up 19% since July, Wegovy’s is up 3%, and Ozempic has stayed within a tight range. Customers feel Mounjaro is more effective than competing drugs, but it’s harder to get . Mounjaro outperforms other GLP-1 drugs in effectiveness, lifestyle impact, and side effects. However, customers dislike its cost and availably more than competitors.
Share by: