Resilient spending on staples contrasts with a dip in discretionary items, capturing the attention of business leaders and investors. As Home Depot's Q2 report highlights slowdowns in spending on big-ticket and discretionary items, we drill into the data to understand any implications for Lowe’s (reports August 22) and broader home-related industries.


Examining 1.2 million pieces of customer feedback from “The Crowd” of retail shoppers, including 80,000 across 17 home improvement brands, we find:

Key Takeaways

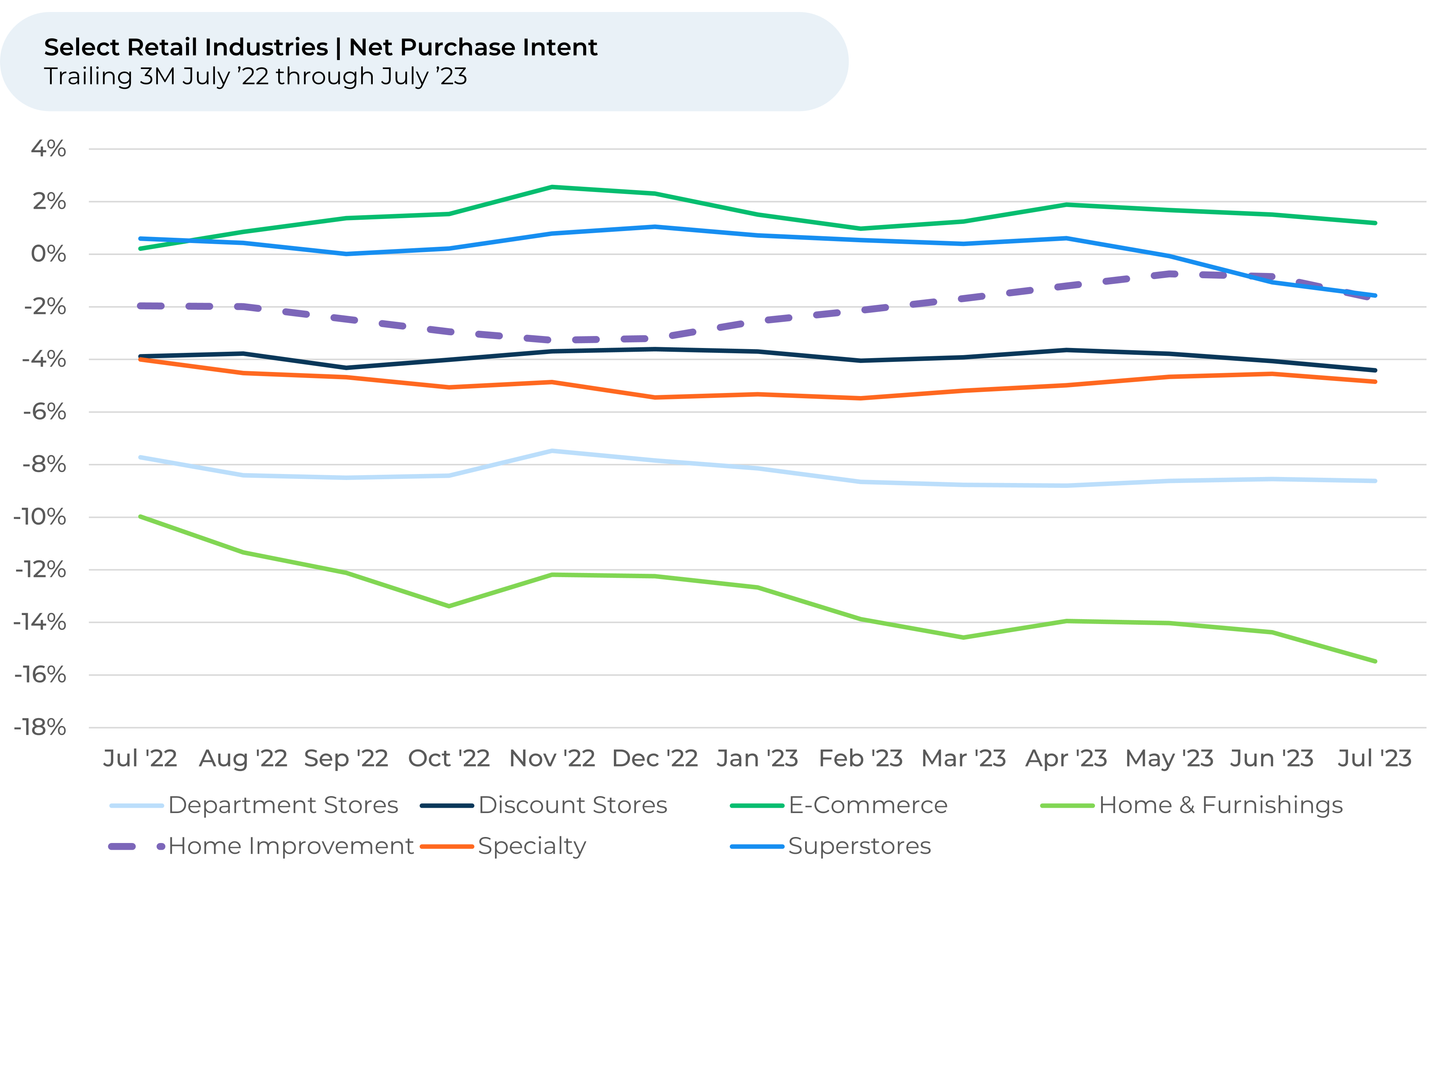
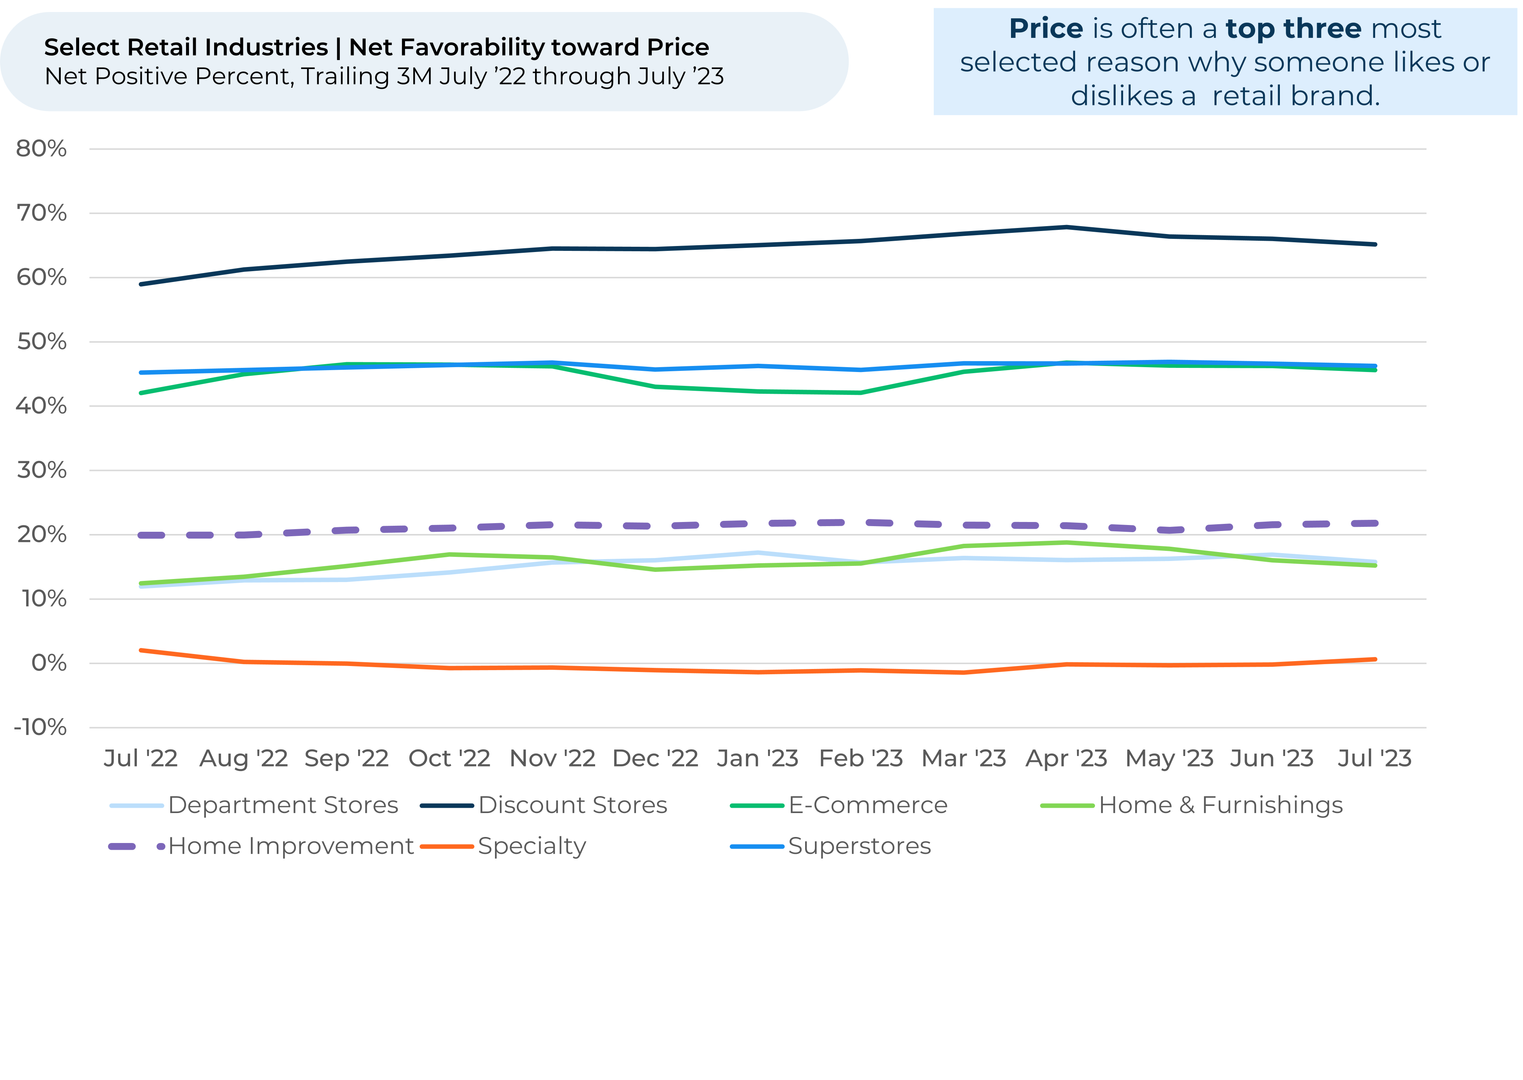
  • Net Purchase Intent¹,² for the home improvement industry fell 1% from three months ago but remained in the same range as the last year. However, the more discretionary home & furnishings industry is down the most of any retail industry we follow, down 2% in the last three months and 5% over the last year.
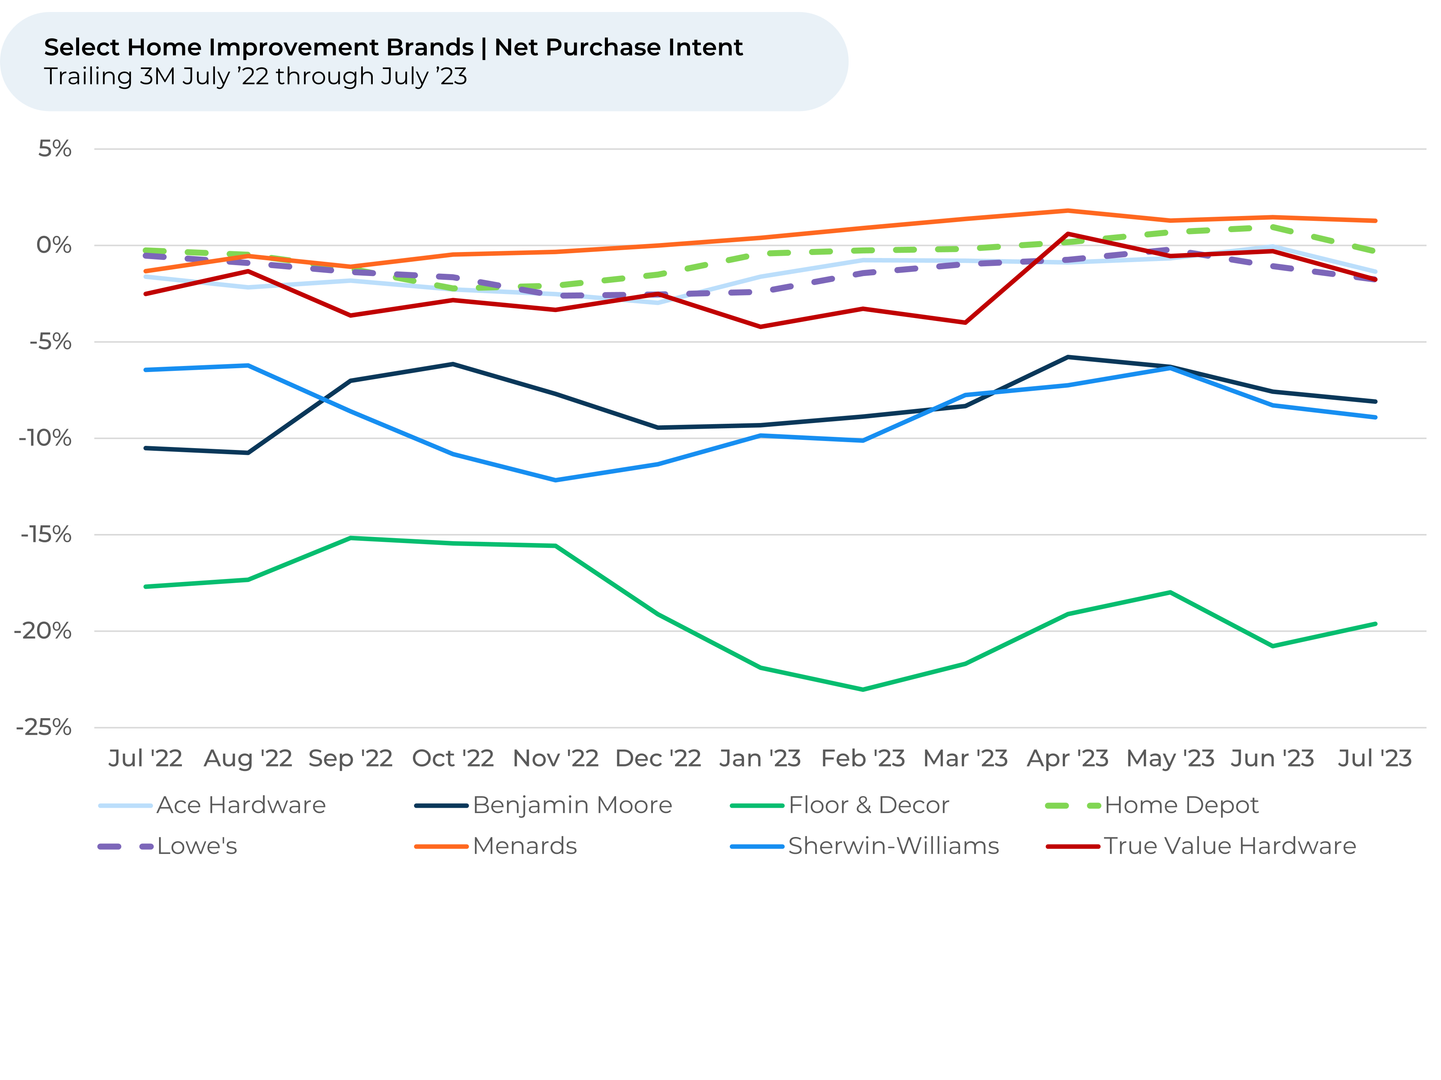
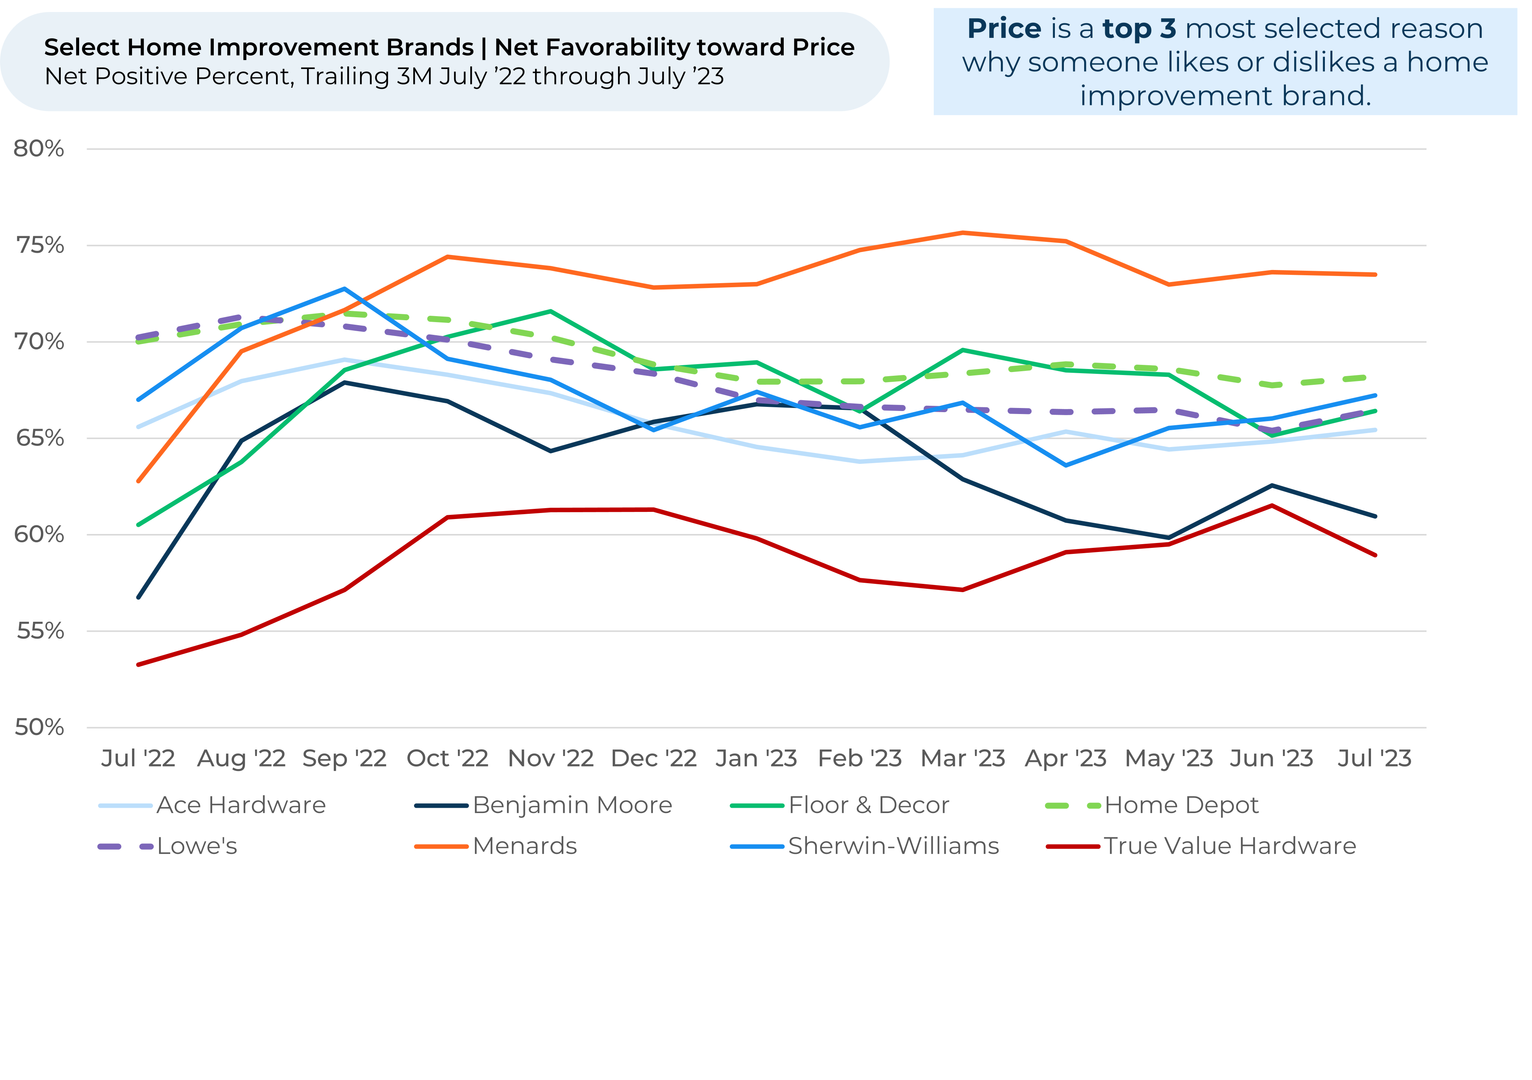
  • Within home improvement, Purchase Intent was down the most for the paint companies over the last three months (-2%), in line with the broader trend of discretionary spending being softer than staples. 
  • Lowe’s 1% decline in Purchase Intent over the last three months was greater than Home Depot being flat, indicating its sequential growth trend is likely to be a little weaker. Home Depot reported 2Q US comp sales growth of -2% vs. the prior year, better than -5% reported in 1Q. 
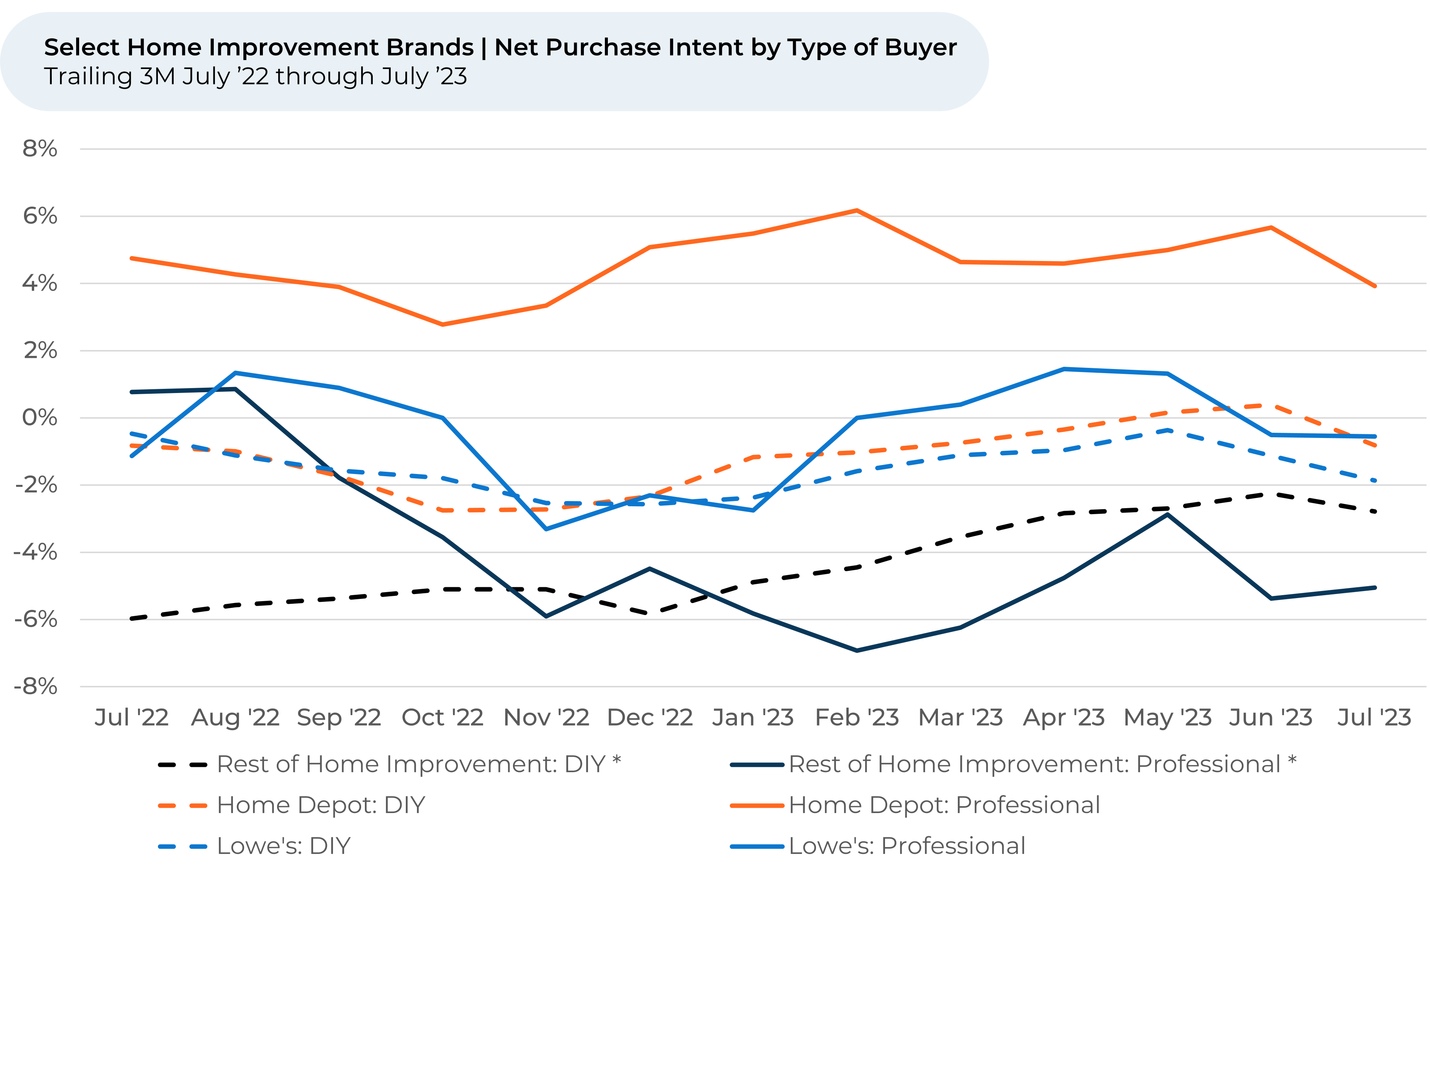
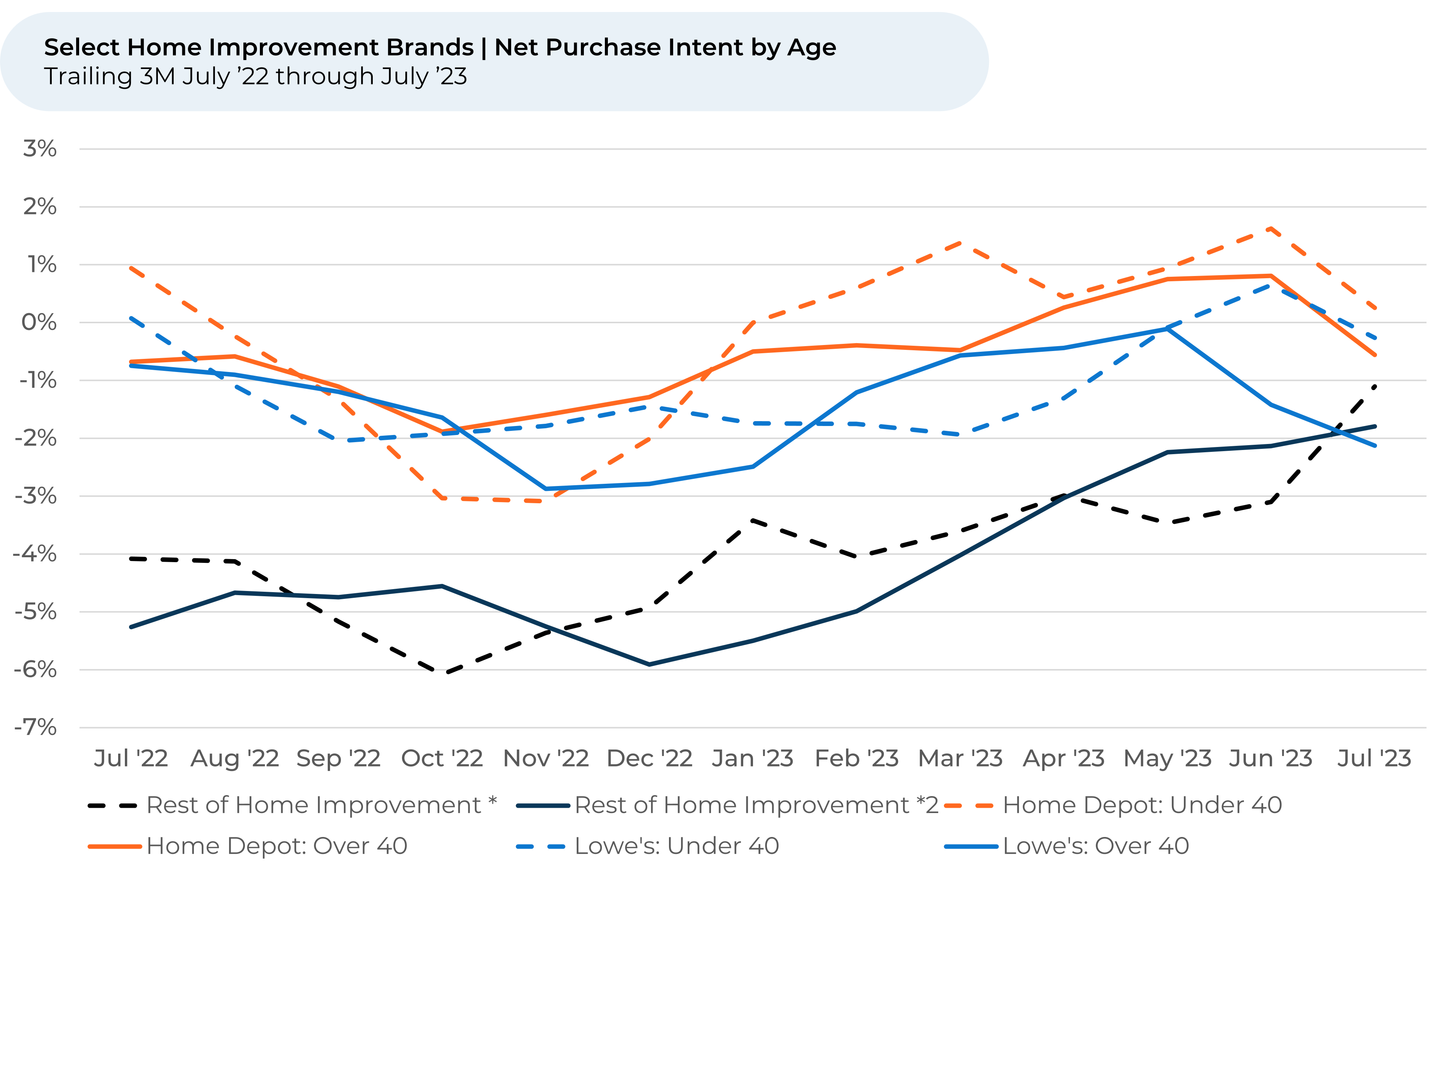
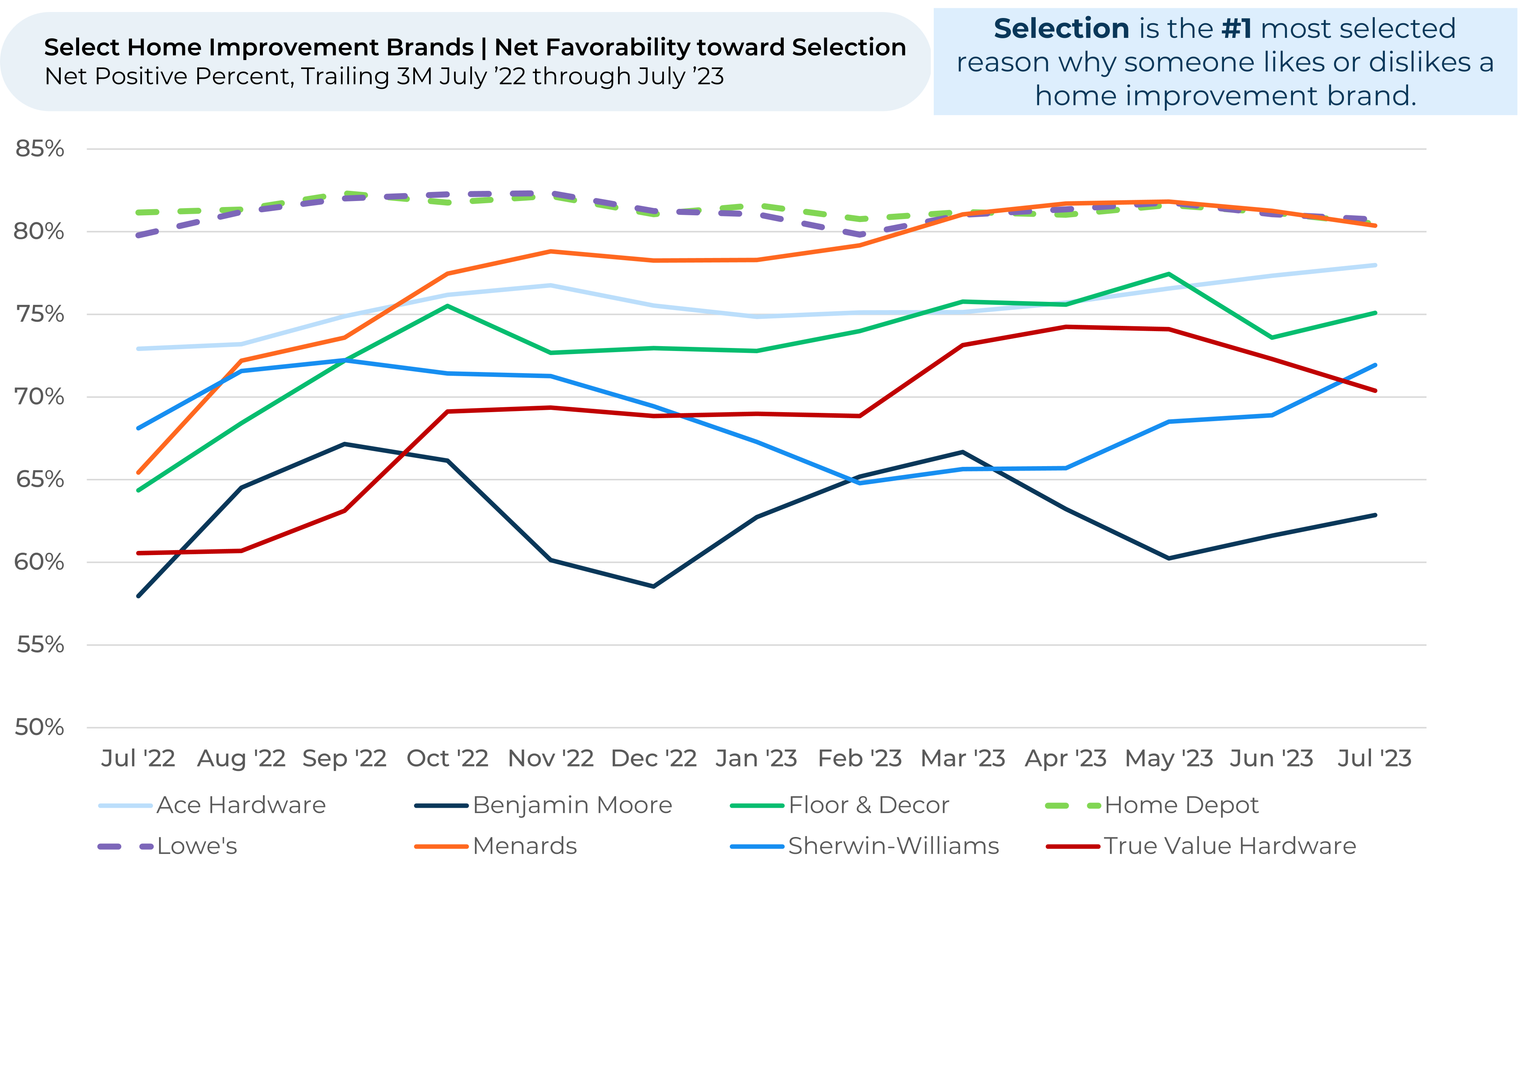
  • Purchase Intent for the Home Improvement industry overall dropped more among professional contractors than DIY-ers and customers over 40 (those most likely to own a home, according to U.S. Census Bureau) than those under 40 over the past three months. This aligns with Home Depot’s Q2 earnings report, which noted slowing demand for professional projects and appliances. Lowe’s Purchase Intent dropped more than Home Depot’s for customers who are professionals, DIYers and over 40. 


  • Slide title

    Write your caption here
    Button
  • Slide title

    Net Purchase Intent for the home improvement industry fell 1% from three months ago but remained in the same range as the last year. However, the more discretionary home & furnishings industry is down the most of any retail industry we follow, down 2% in the last three months and 5% over the last year.

    Button
  • Slide title

    Within home improvement, Purchase Intent was down the most for the paint companies the last three months (-2%), in line with the broader trend of discretionary spending being softer than staples. Lowe’s 1% decline the last three months was greater than Home Depot being flat, indicating its sequential growth trend is likely to be a little weaker.

    Button
  • Slide title

    Over the past six months, Net Purchase Intent dropped 2% among customers buying for professional projects, but it stayed within a tight range for DIY-ers. Notably, Lowe’s is seeing more pullback than Home Depot for both groups, but the decline is less for DIY-ers. *Note: The industry values exclude Home Depot/Lowe’s.

    Button
  • Slide title

    Since April, Purchase Intent dropped 1% for home improvement customers over 40 – the age group that, according to the U.S. Census Bureau, are most likely to own a home. Meanwhile, Purchase Intent has been flat for people under 40. Lowe’s Purchase Intent among customers over 40 dropped 2% over the past three months vs. 1% for Home Depot. *Note: The industry values exclude Home Depot/Lowe’s.

    Button
  • Slide title

    The Purchase Intent declines mirror drops in consumer’s feelings about pricing. Net favorability for Price fell 1% for the Home improvement industry over the past three months; it fell 3% for the home and furnishings industry.

    Button
  • Slide title

    Customer net favorability toward Price fell 1% for Home Depot over the past three months and stayed stable for Lowe’s. This is mostly in line with their biggest competitors; however, Sherwin-Williams Price net favorability grew 4% since April, but remains in a tight range from a year ago.


    Button
  • Slide title

    Home improvement shoppers like Menards’ selection much more than they did a year ago. Net favorability toward Selection increased 15% from July 2022 – July 2023, matching Lowe’s and Home Depot for a place on top. 

    Button

Please contact our team for a deeper look at HundredX's home improvement data, which includes more than 160,000 pieces of customer feedback across over 17 home improvement brands (including over 60,000 on Home Depot).


  1. All metrics presented, including Net Purchase (Purchase Intent) and Net Positive Percent / Favorability, are presented on a trailing one-month basis unless otherwise noted.
  2. Purchase Intent represents the percentage of customers who expect to spend more with that chain over the next 12 months, minus those that intend to spend less. We find businesses that see Purchase Intent trends gain versus the industry or peers have often seen revenue growth rates, margins and/or market share also improve versus peers. 
  3. HundredX measures Net Favorability towards a driver of customer satisfaction as Net Positive Percent (NPP), which is the percentage of customers who view a factor as a positive (reason they liked the products, people, or experiences) minus the percentage who see the same factor as a negative.


Strategy Made Smarter


HundredX works with a variety of companies and their investors to answer some of the most important strategy questions in business:

  • Where are customers "migrating"?
  • What are they saying they will use more of in the next 12 months?
  • What are the key drivers of their purchase decisions and financial outcomes?


Current clients see immediate benefits across multiple areas including strategy, finance, operations, pricing, investing, and marketing.


Our insights enable business leaders to define and identify specific drivers and decisions enabling them to grow their market share.


Please contact our team to learn more about which businesses across 75 industries are best positioned with customers and the decisions you can make to grow your brand’s market share.

####


HundredX is a mission-based data and insights provider. HundredX does not make investment recommendations. However, we believe in the wisdom of the crowd to inform the outlook for businesses and industries. For more info on specific drivers of customer satisfaction, other companies within 75+ other industries we cover, or if you'd like to learn more about using Data for Good, please reach out: https://hundredx.com/contact.

Share This Article

06 May, 2024
Sure, lattes, mochaccinos, and cappuccinos are pricey, but they taste delicious. For many consumers, the great taste of coffee shop coffee made it worth the cost. But customers at Starbucks aren't so sure the tradeoff is worth it anymore. Examining more than 420,000 pieces of feedback across the Quick, Fast, Casual (QFC) industry, including over 21,000 on Starbucks, we find: Starbuck's Purchase Intent 1,2 is down 3% over the past six months, with most of that dip occurring over the past few months. By contrast, Dunkin' Donuts has remained within a tight range over the past six months, as did an average of other, smaller coffee chains. Customers increasingly see less value in Starbucks. Starbuck's Value perception 3 fell 5% over the past six months, compared to just 1% for Dunkin' Donuts. However, it also fell 5% for the average of the smaller coffee chains. Coffee drinkers feel significantly unhappier about Starbuck's quality and taste. Starbuck's Taste perception fell 4% over the past six months, while rising 1% for competitors. Likewise, its Quality perception dipped 3% over the same time period (and 8% over the year). Ultimately, Starbuck's perceived drop in taste is leading inflation-weary consumers to say they plan to spend less at the coffee chain, as the value just isn't as good.
06 May, 2024
Forbes Best Brands for Social Impact, Powered by HundredX
06 May, 2024
Ozempic once dominated the headlines, but GLP-1 competitor Mounjaro is winning over customers. GLP-1 drugs, used for treating diabetes and aiding in weight loss, are relatively new on the market yet have surged in popularity over the last year. They're becoming so popular that J.P. Morgan estimates that 30 million people in the US may be using a GLP-1 drug by 2030. This statistic presents a significant potential for early drug creator Novo Nordisk (Ozempic, Wegovy), and perhaps an even bigger one for Eli Lilly (Mounjaro, Zepbound). HundredX data indicates Eli Lilly is in a position to win over Novo Nordisk as Mounjaro's Usage Intent widens against the competition. Ozempic may have name recognition, but customers feel more positively about Mounjaro's effectiveness and lifestyle impact, even if they aren't excited about its high price. Examining 1,500 pieces of customer feedback across Mounjaro, Ozempic, and Wegovy, we find: GLP-1 users increasingly say they plan to use Mounjaro more, and Ozempic less . Mounjaro’s Usage Intent is up 19% since July, Wegovy’s is up 3%, and Ozempic has stayed within a tight range. Customers feel Mounjaro is more effective than competing drugs, but it’s harder to get . Mounjaro outperforms other GLP-1 drugs in effectiveness, lifestyle impact, and side effects. However, customers dislike its cost and availably more than competitors.
Share by: