
With most of the top streaming services raising rates, shifting from a focus on customer acquisition to profitability, we wonder how they sit with customers?
On Disney’s Q3 earnings call, August 9th, Disney became the latest, with CEO Bob Iger saying the company is “actively exploring ways to address account sharing” and announcing significant price hikes for Disney+ (+27% for the ad-free tier) and Hulu (+20% for the ad-free tier) starting October 12th.
HundredX looks to “The Crowd” of streaming viewers to understand the state of video streaming and see how Disney’s pricing moves may impact demand for the service. Our proprietary pricing power model indicates that while Hulu appears to have room to raise prices, customers probably won’t be as forgiving with Disney+’s price hike. Our model indicates Amazon Prime Video, Hulu, and Apple TV+ have the most room to raise prices without significantly hurting demand.
Examining 350,000 pieces of customer feedback on home entertainment industries, including more than 100,000 across 22 video streaming platforms, we find:
Key Takeaways
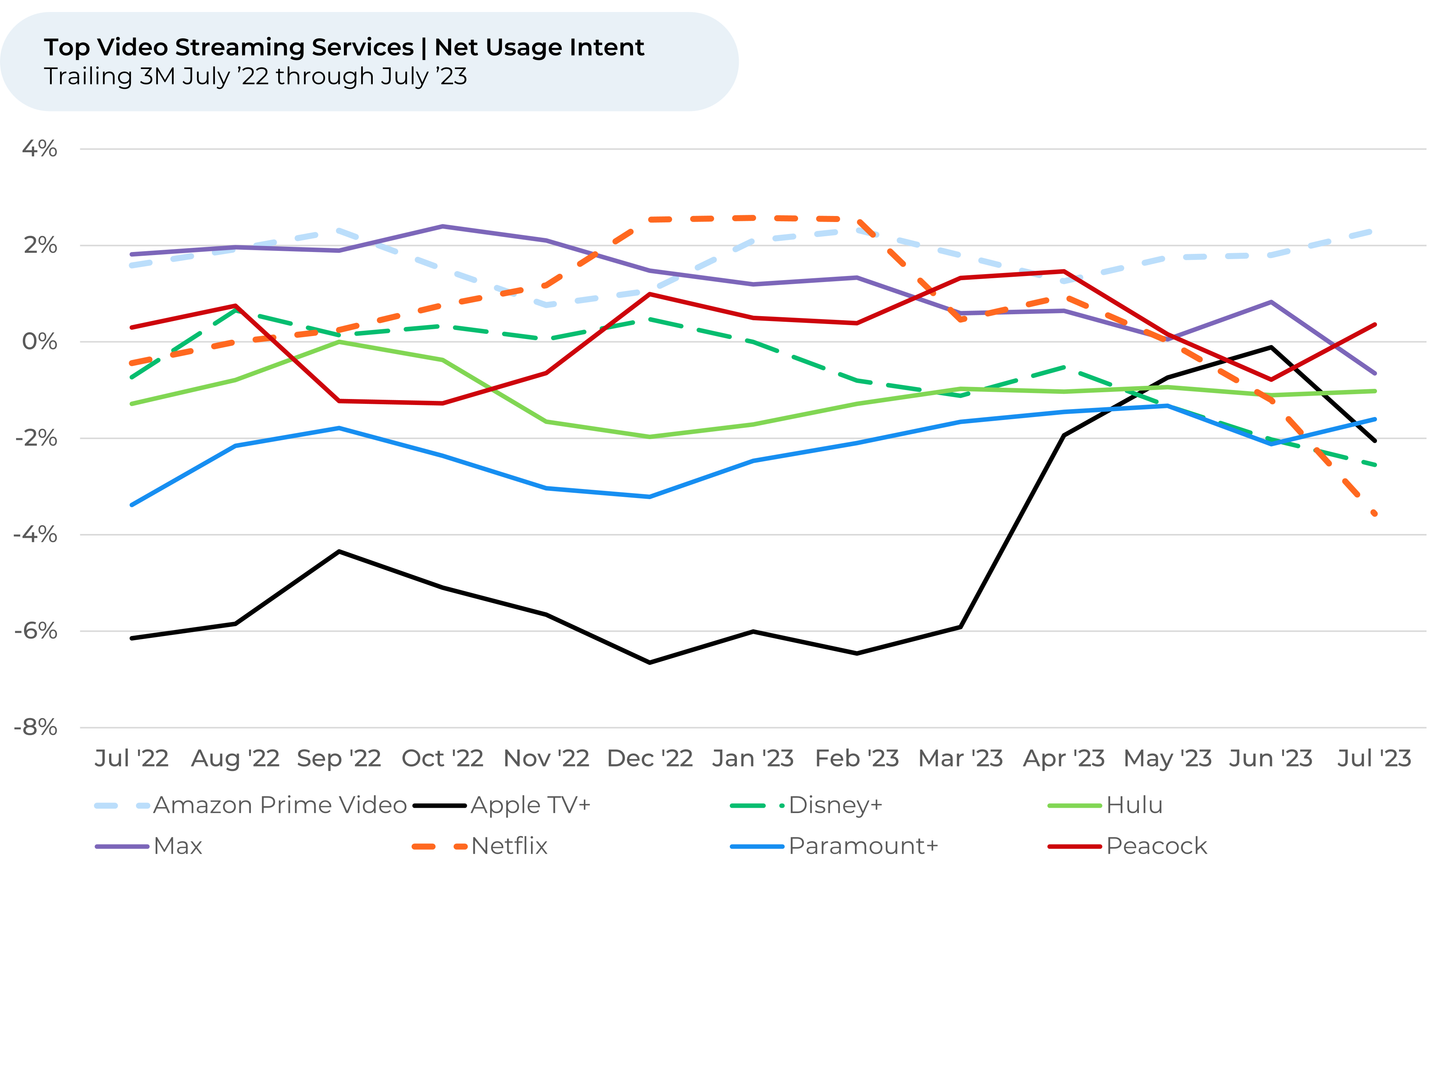
- Over the past three months,
future Usage Intent¹,² dipped (-1%) for the video streaming industry along with music streaming and social media & search. It remained steady for the video game industry, while it rose slightly (+1%) for news media.
- Video streaming’s future usage dip is led by Netflix. Out of the biggest video streaming services, Netflix fell the most over the past three months (-5%), followed by Disney+ (-2%). Only Amazon Prime Video is up (+1%).
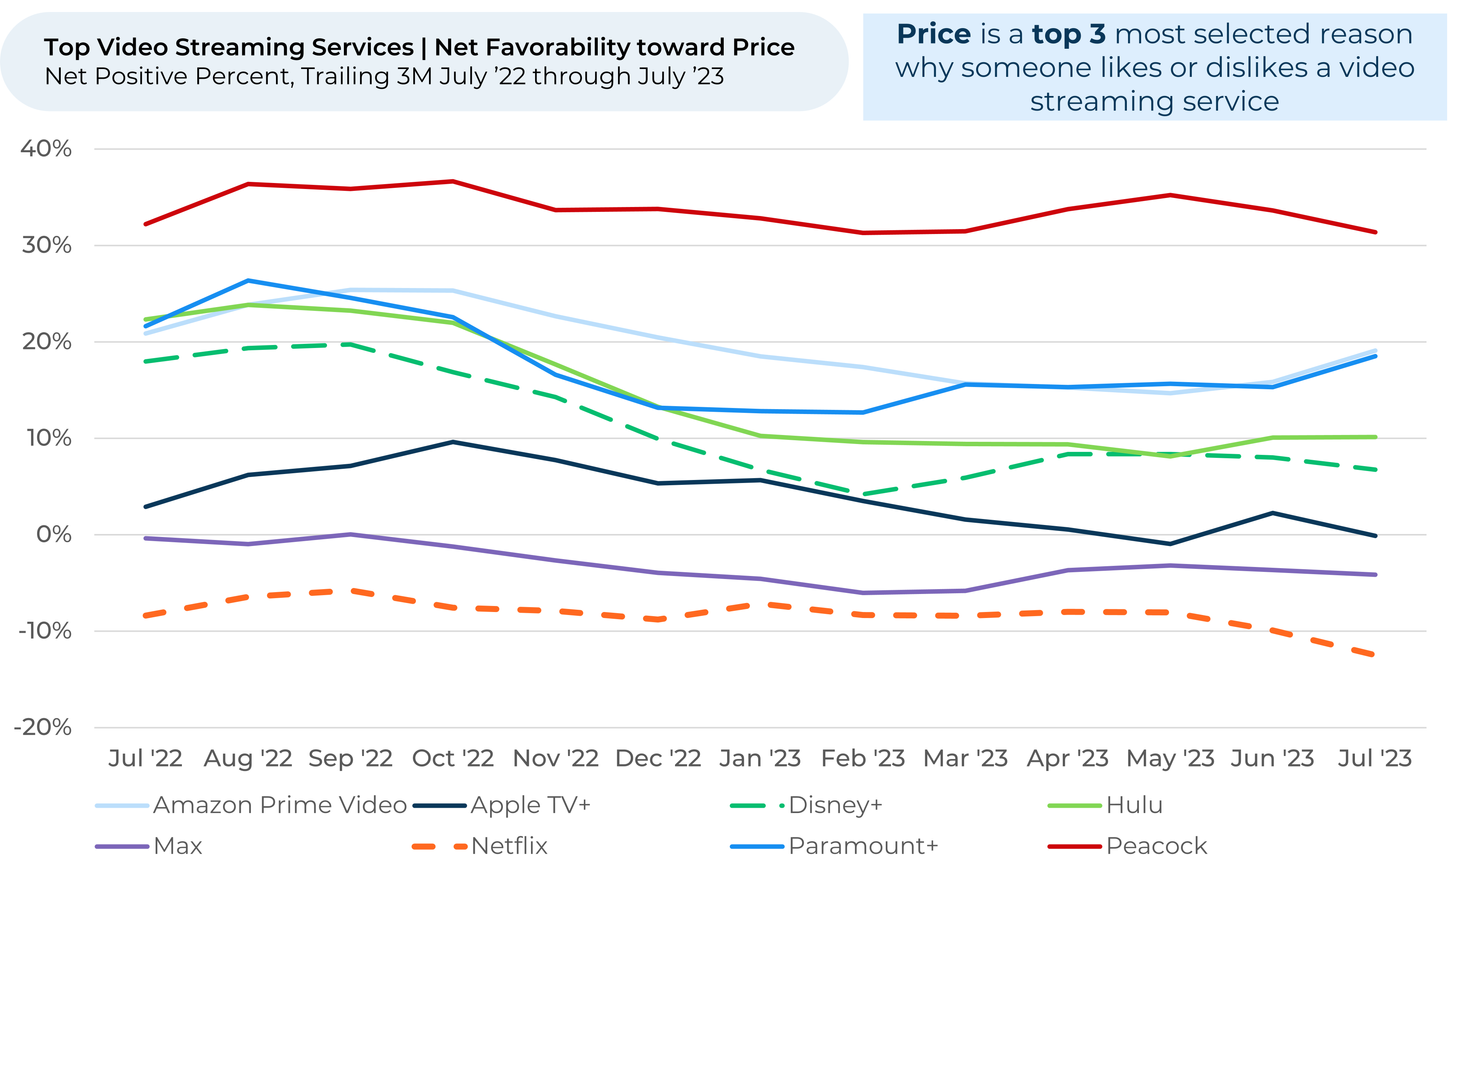
- Netflix’s fall appears primarily driven by price.
Since Netflix implemented its extra account-sharing charges in late May, customers have felt notably worse about the price of the service. Net favorability³ toward Price dipped 5% since May, far more than any of Netflix’s competitors.
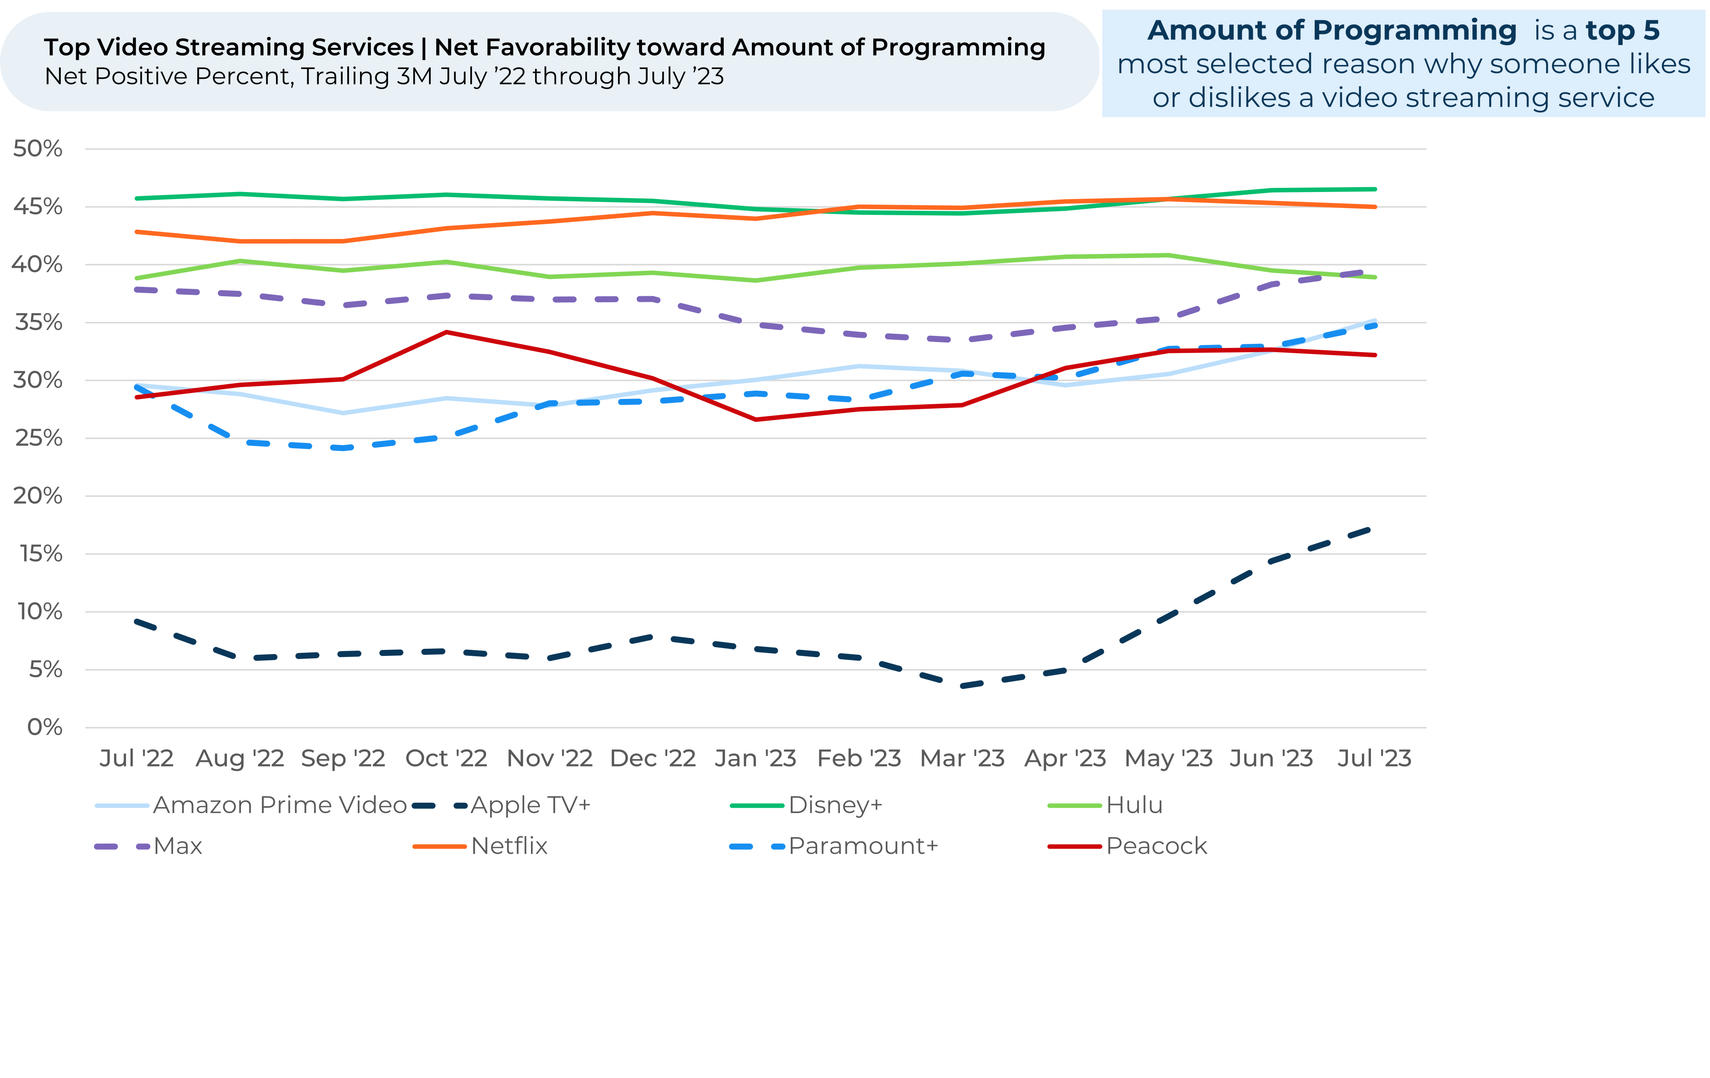
- Netflix’s fall is also driven by Apple TV+, Max, and Paramount+ narrowing the gap on programming.
Over the last three months, net favorability towards Amount of programming jumped for Apple TV+ (12%), Max (5%) and Paramount+ (5%), while Netflix was flat. All three added to their content via platform mergers, content deals, and new shows and movies.
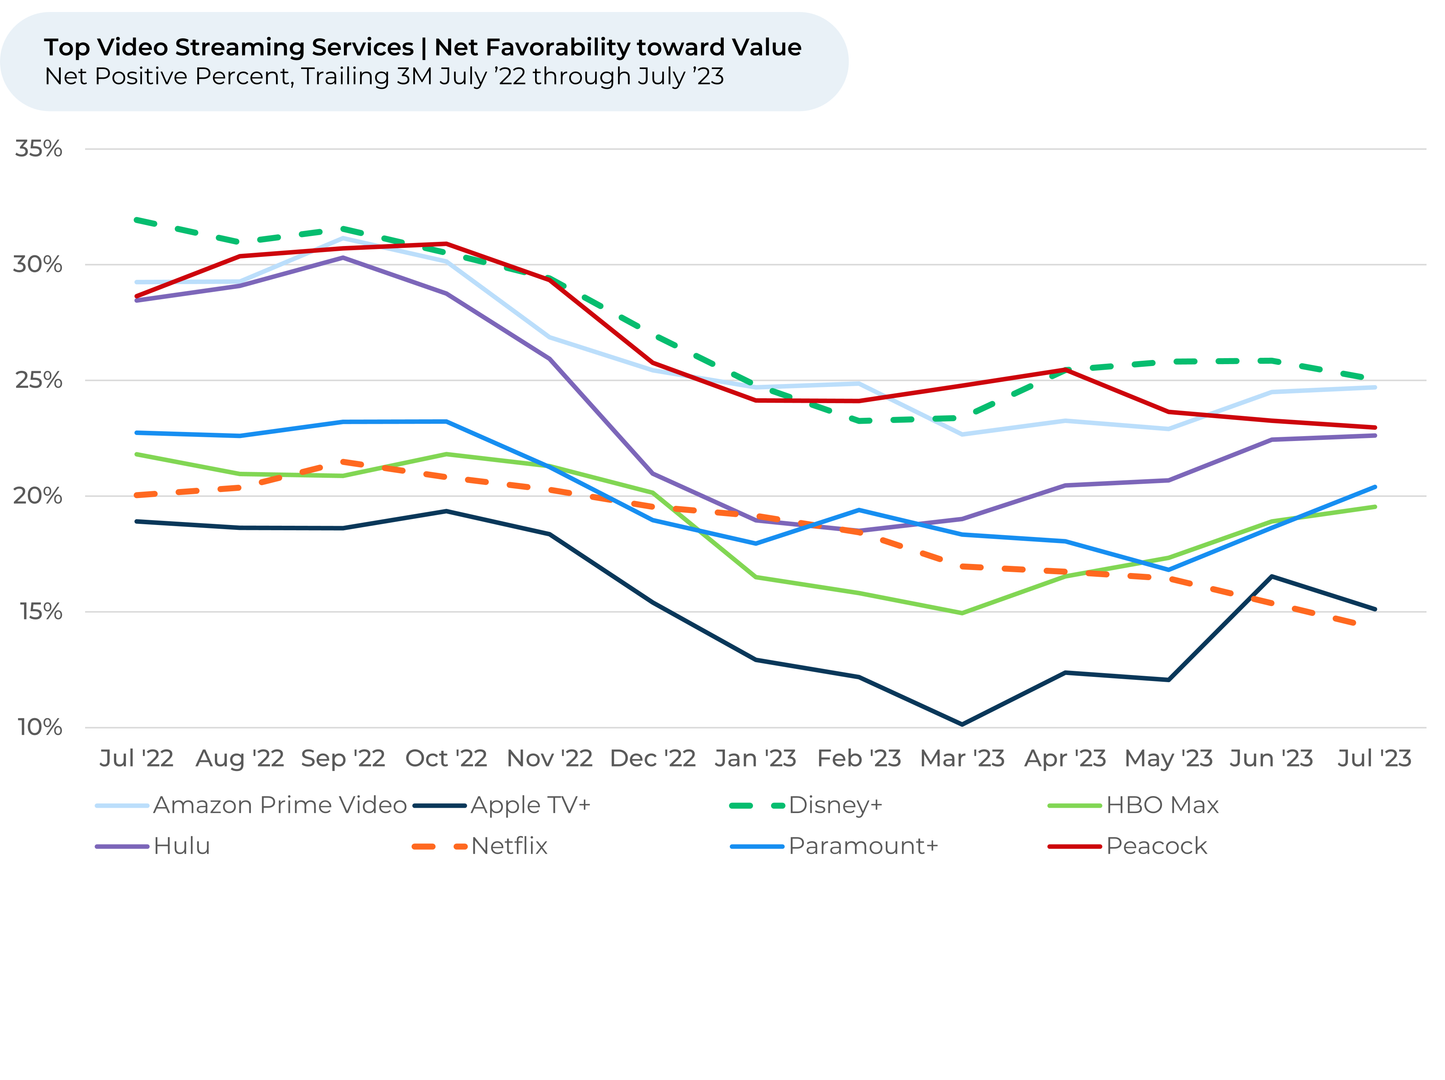
- Disney should consider the drop in Netflix’s future growth as it raises prices and considers account-sharing charges. While customers like the value of Disney+ more than its peers, its Value net favorability has fallen the most over the past year (-7%), putting it only very slightly above Amazon Prime Video. Hulu has gained in usage intent, price, and value net favorability vs. peers over the last three months, while Disney+ has slipped.
- But it’s not all bad news for Disney.
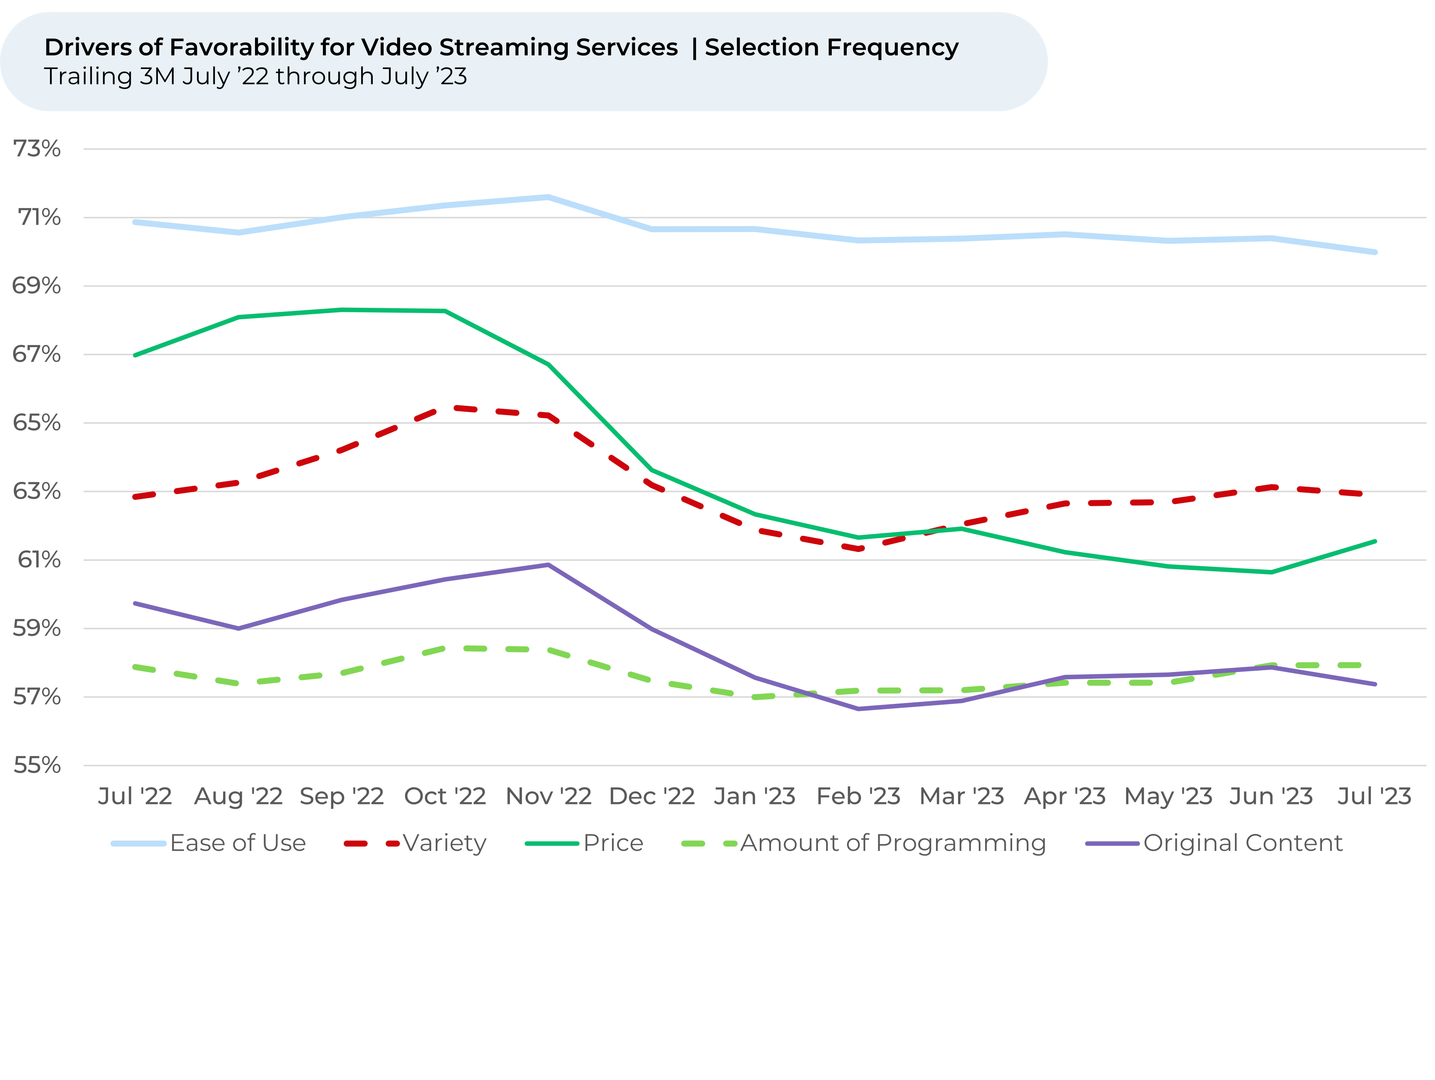
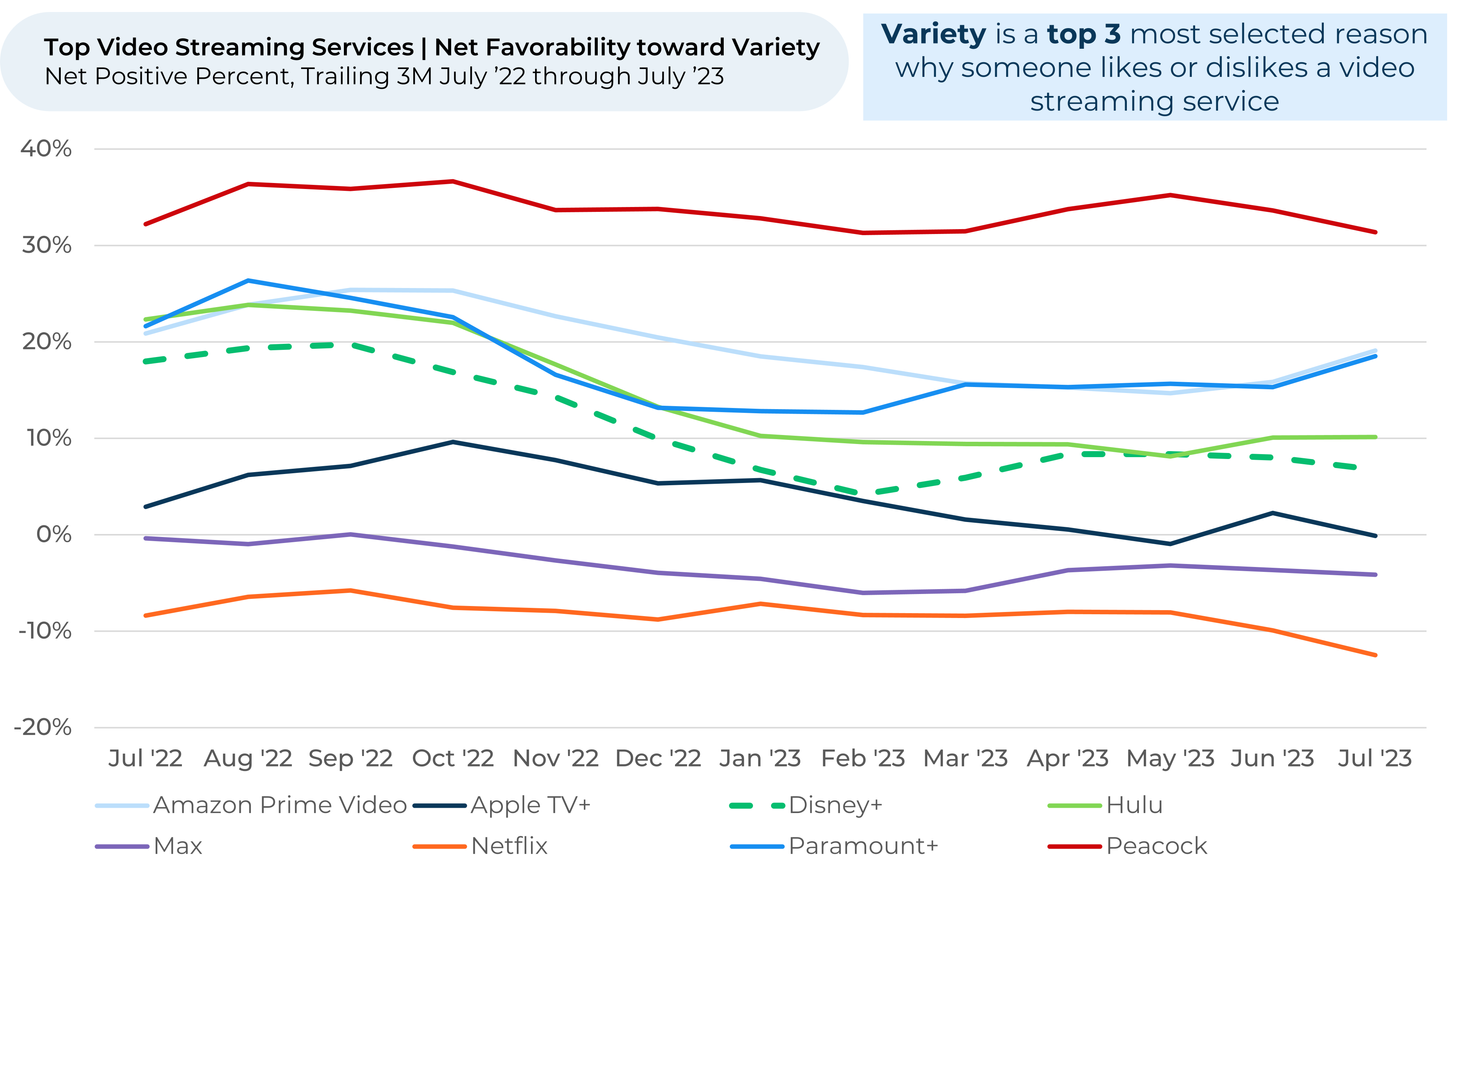
While Disney+ has slipped versus peers on variety in recent months, its continued integration of Hulu content could please viewers. Recent platform integrations of HBO Max with Discovery+ and Paramount+ with Showtime helped drive Usage Intent higher for those platforms, as customers view program variety as an increasingly important reason to like or dislike a streaming service. Variety is now the 2nd most selected driver of customer satisfaction, overtaking price in April.
Discover HundredX insights into Video Streaming Trends:


Please contact our team for a deeper look at HundredX's video streaming data, which includes more than 220,000 pieces of customer feedback across 22 streaming services.
- All metrics presented, including Net Usage Intent (Usage Intent), and Net Sentiment / Net Positive Percent are presented on a trailing three-month basis unless otherwise noted.
- Usage Intent reflects the percentage of customers who plan to use a specific brand more during the next 12 months, minus the percentage who plan to use less. We find businesses that see customer Intent trends gain versus the industry have often seen revenue growth rates, margins and/or market share also improve versus peers.
- HundredX measures net favorability toward a driver of customer satisfaction as Net Positive Percent (NPP), which is the percentage of customers who view a factor as a positive (reason they liked the products, people, or experiences) minus the percentage who see the same factor as a negative.
Strategy Made Smarter
HundredX works with a variety of companies and their investors to answer some of the most important strategy questions in business:
- Where are customers "migrating"?
- What are they saying they will use more of in the next 12 months?
- What are the key drivers of their purchase decisions and financial outcomes?
Current clients see immediate benefits across multiple areas including strategy, finance, operations, pricing, investing, and marketing.
Our insights enable business leaders to define and identify specific drivers and decisions enabling them to grow their market share.
Please contact our team to learn more about which businesses across 75 industries are best positioned with customers and the decisions you can make to grow your brand’s market share.
####
HundredX is a mission-based data and insights provider. HundredX does not make investment recommendations. However, we believe in the wisdom of the crowd to inform the outlook for businesses and industries. For more info on specific drivers of customer satisfaction, other companies within 75+ other industries we cover, or if you'd like to learn more about using Data for Good, please reach out: https://hundredx.com/contact.
Share This Article