As we monitor one of the busiest times of the year for Retail sales, we look to The Crowd to get a read on the top Electronics products. Positive Usage intent¹ trends continue for Electronics versus entertainment sectors that tend to compete for our attention throughout the day, including Media, Video Streaming, Music Streaming, and Social Media & Search. 


  • Electronics’ usage intent remained positive and stable during the past six months, with select speakers / audio (Apple HomePod, Beats by Dre) and video (GoPro, Facebook Portal) brands among the ones gaining far more than others.
  • Theragun remains the top product overall, but Apple continues to dominate all other brands broadly, with its HomePod experiencing the strongest usage intent of its portfolio.
  • The top Electronics brands do a great job of satisfying customers on the factors they say are most important: Technology, Usability, and Price.
  • The strong usage growth trends indicate Apple HomePod, GoPro, and Beats By Dre all are likely to experience market share growth. Usage is correlated with share of time spent and retention, which can be a leading indicator of market share.


Leveraging HundredX’s proprietary listening methodology, we evaluate more than 186,000 pieces of feedback from real customer experiences across the country. We use that data for insights into customers’ future Usage Intent,¹ changing demands on Electronics brands, and which companies look to benefit most.

Overall Usage intent for Electronics remained steady at 6% in November 2022, up slightly from a low of 5% in May 2022. Usage Intent reflects the percentage of customers who plan to use a specific brand during the next 12 months minus the percentage that plan to use less.

Top Overall Usage Intent leaders

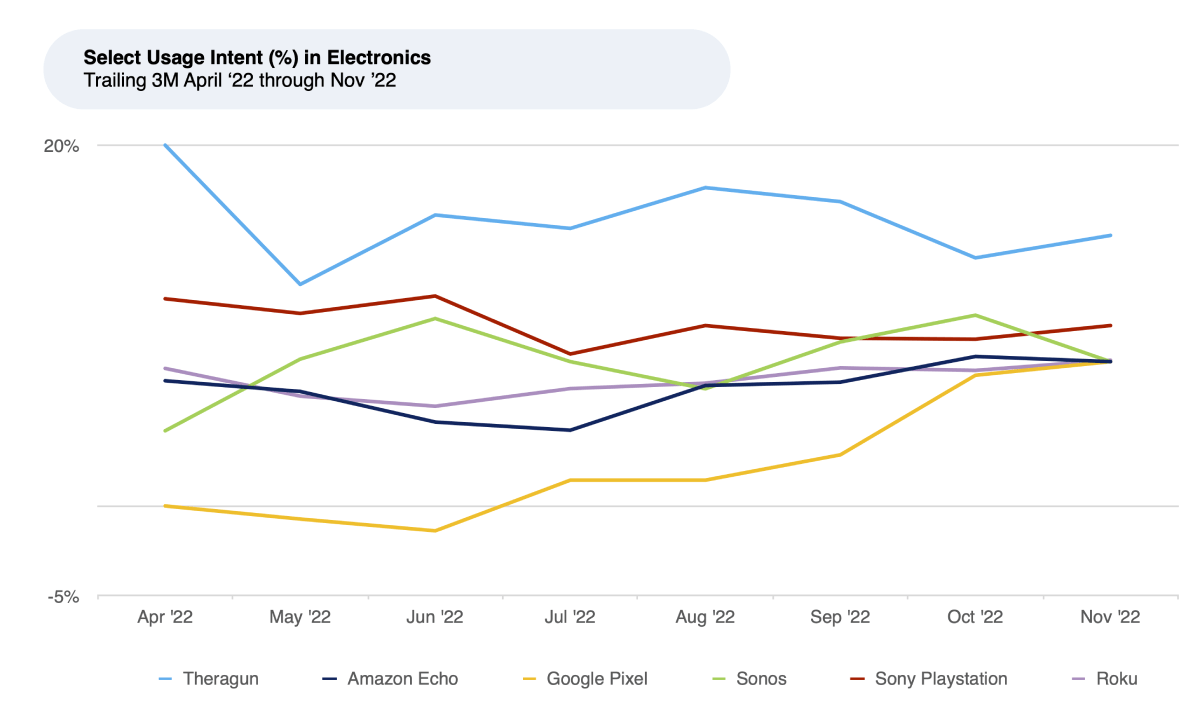
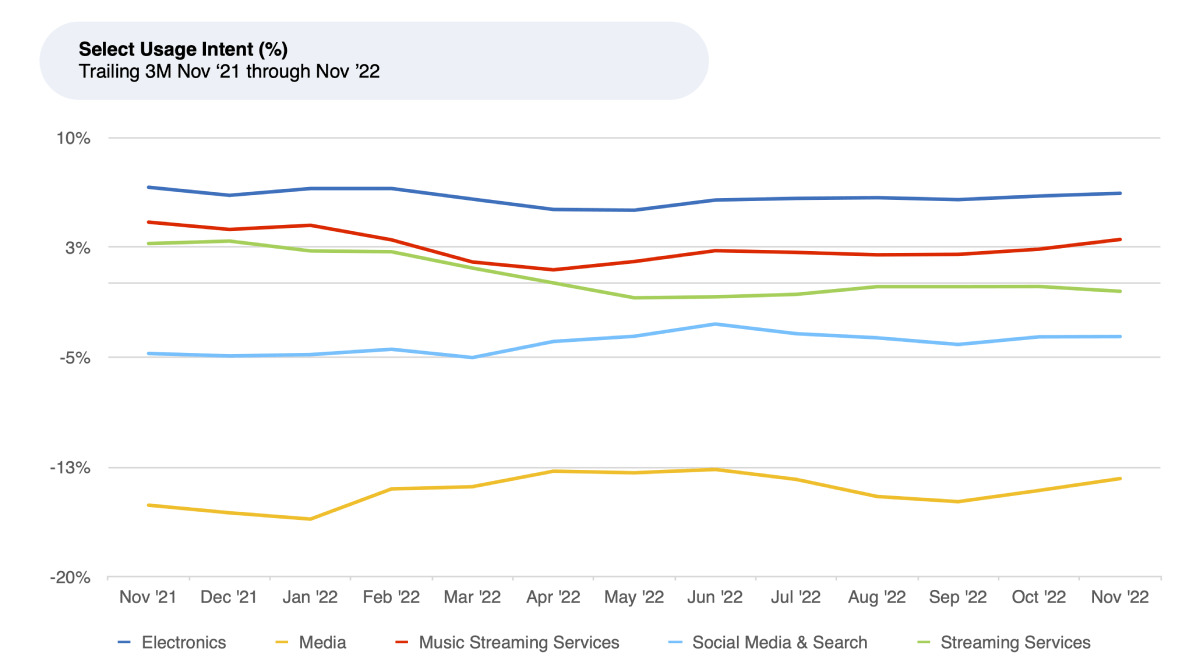
Though Usage Intent for the broader Electronics group has been stable in a 5%-6% range for the last year, we observe positive trends for leaders including Theragun, Apple and Canon.


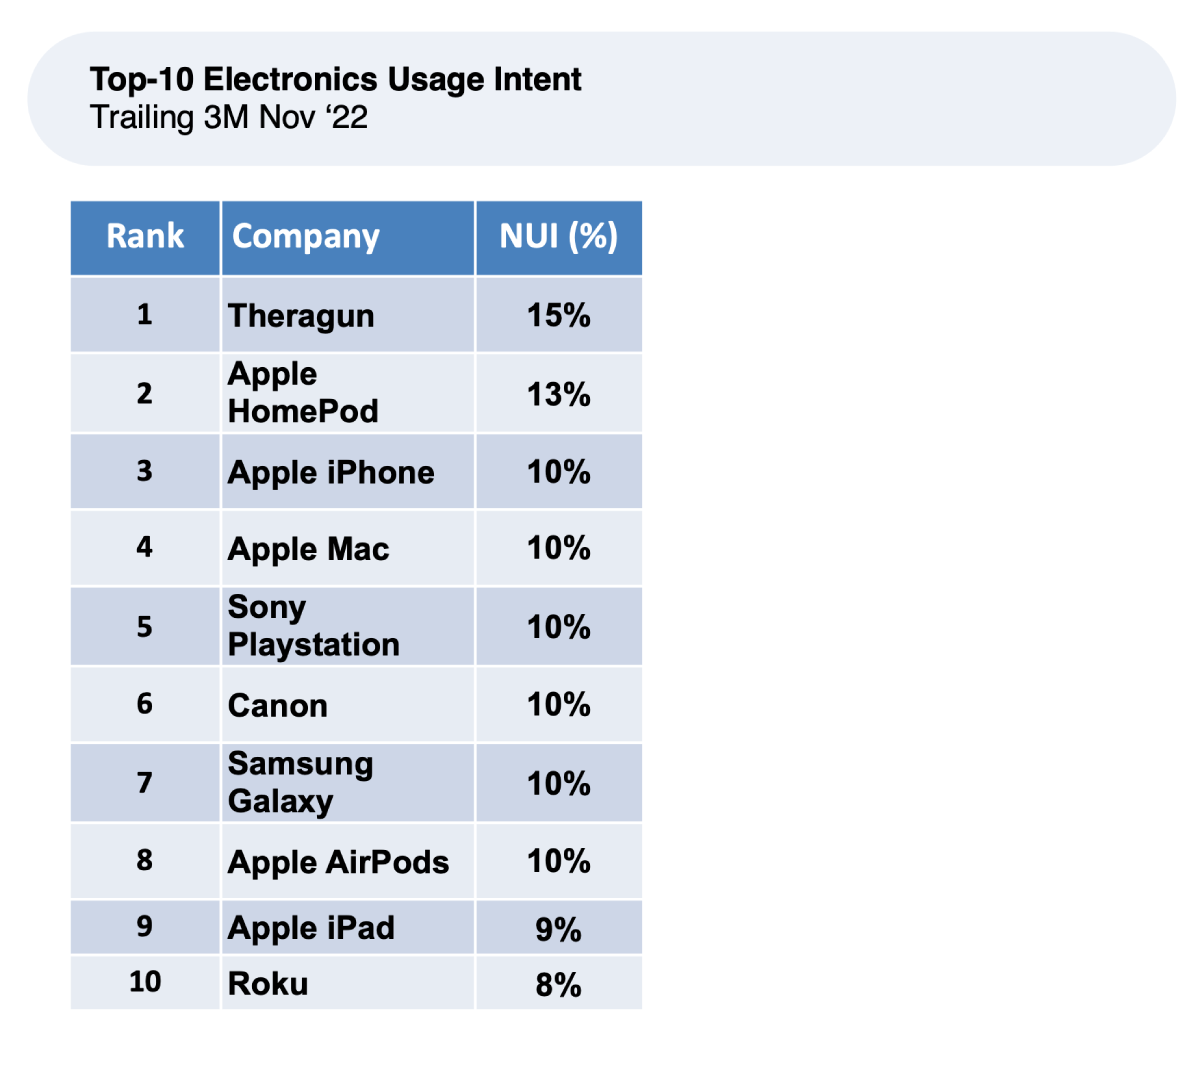
The Crowd tells us that they intend to use the following products and brands more.


Theragun, the Usage intent leader in Electronics, increased from 12% in May 2022 to 17% September 2022 before dropping to 15% in November 2022. Boosted by discount pricing and Amazon Prime sales, Theragun remains the category leader with the most consumers who want to use it more. Over the last six months, Theragun saw its user satisfaction increase vs. the Electronics sector most significantly for Usability, Reliability, Instructions, and Install / Setup. HundredX measures customer satisfaction with specific factors as the percentage of customers that select it as a reason he or she likes the brand minus the percentage that choose it as a reason he or she does not. Theragun improved by 10% to 25% vs. peers on all four factors over the last six months. One happy customer recently told HundredX, “I had no idea how amazing this would be! It is a game changer!!!” Another added, “Purchased the mini on sale and was so happy with the usability of it. I purchased another one for my mother who also uses it daily.”

Theragun, the Usage intent leader in Electronics, increased from 12% in May 2022 to 17% September 2022 before dropping to 15% in November 2022. Boosted by discount pricing and Amazon Prime sales, Theragun remains the category leader with the most consumers who want to use it more. Over the last six months, Theragun saw its user satisfaction increase vs. the Electronics sector most significantly for Usability, Reliability, Instructions, and Install / Setup. HundredX measures customer satisfaction with specific factors as the percentage of customers that select it as a reason he or she likes the brand minus the percentage that choose it as a reason he or she does not. Theragun improved by 10% to 25% vs. peers on all four factors over the last six months. One happy customer recently told HundredX, “I had no idea how amazing this would be! It is a game changer!!!” Another added, “Purchased the mini on sale and was so happy with the usability of it. I purchased another one for my mother who also uses it daily.”

Apple Mac usage intent rose from 8% in April 2022 to 12% in October before easing to 10% in November. While most computer brands (Lenovo, Dell, HP, Asus) saw shipments fall steeply in Q3 2022, Apple Mac sales are up 40% year-over-year according to IDC. Promotions on the M1 24” Mac and the discontinuation of the 27” Mac helped boost volume. Quality satisfaction (69% vs. 54% broader Electronics) remains the Mac’s strong preference point, followed by Design (68% vs. 55%), and Usability (63% vs. 59%). 

Top Usage Intent Movers


Apple HomePod, Lenovo, and GoPro had the largest three-month usage intent improvements for our electronics coverage. Below we look at the products and brands that posted the largest three-month increase November versus August 2022.

Apple HomePod has seen the greatest intent gain over the last three months, rising from -8% in August to +13% in November 2022. The competitive home smart speaker category remains hot, and Apple’s clear dominance in other areas carries over. HomePod saw the greatest improvements in customer sentiment towards its Technology, Design, and Quality.

GoPro, which has seen its share of success and failure over the years, shows strong usage intent gains, rising from 0% to +6%, August to November 2022. Significant enrollment growth has been driven by its subscription-based unlimited cloud storage, the capacity to upload footage to the cloud directly from GoPro cameras, premium editing tools in the Quick App, and a private streaming platform to enable storytelling and immersive sharing. One customer told HundredX in October, “Just bought another one due to quality/usability.” Another shared, “Love it. Captures so many memories. App is great to making videos.” GoPro saw the greatest improvements in customer sentiment towards its Technology, Usability, Features, and Quality.


Beats by Dre, owned by Apple, continues to gain in usage intent, implying market share gains are likely. Beats rose from usage intent 6% below the group average in April 2022 to 4% ahead in November 2022. Last quarter demand increased 553% year-on-year to reach 2.4 million units. Research firm Canalys attributes the sharp increase to the new Beats Studio Buds and Beats Fit Pro earphones. Whereas, AirPods are marketed specifically to iPhone owners, the most recent Beats earphones are optimized to work with both Android and iPhones. Beats by Dre saw the greatest improvements in customer sentiment towards its Quality, Install/Setup, Packaging and Value, all up 5%–15% over the last six months.

Customer Satisfaction most impacted by Technology, Usability, and Price


We also find Customer Satisfaction (CSAT) for Electronics (4.5) has remained steady over the course of the last year, one of the top measures for any sector in our coverage. HundredX measures CSAT on a 5-point scale.

HundredX measures sentiment toward a CSAT driver as Net Positive Percent (NPP), which is the percentage of customers who say a driver (such as Quality or Price) is a reason they like a brand/product minus the percentage who say it is a reason they do not like it. The top factors driving Electronics’ customer satisfaction, and the reasons why they prefer specific brands, include Technology (chosen as the top driver, 72% of the time), Usability (71%), Price (70%), Install/Setup (68%), and Design (66%).


While The Crowd tells us that the overall outlook for usage intent will most likely continue its mixed trend, share for specific brands will continue to shift with the popularity of various products. We continue to monitor trends within Electronics and Consumer Products to see if any changes emerge as the shopping season progresses, as well as into 2023. 


  1. All metrics presented, including Net Usage Intent (Usage Intent), and Net Positive Percent / Sentiment are presented on a trailing three-month basis, unless otherwise noted. 

Strategy Made Smarter


HundredX works with a variety of companies and their investors to answer some of the most important strategy questions in business:

  • Where are customers "migrating"?
  • What are they saying they will use more of in the next 12 months?
  • What are the key drivers of their purchase decisions and financial outcomes?


Current clients see immediate benefits across multiple areas including strategy, finance, operations, pricing, investing, and marketing.


Our insights enable business leaders to define and identify specific drivers and decisions enabling them to grow their market share.


Please contact our team to learn more about which businesses across 75 industries are best positioned with customers and the decisions you can make to grow your brand’s market share.

####


HundredX is a mission-based data and insights provider. HundredX does not make investment recommendations. However, we believe in the wisdom of the crowd to inform the outlook for businesses and industries. For more info on our data solutions, other companies within 75+ other industries we cover, or if you'd like to learn more about using Data for Good, please reach out: https://hundredx.com/contact.

Share This Article

06 May, 2024
Sure, lattes, mochaccinos, and cappuccinos are pricey, but they taste delicious. For many consumers, the great taste of coffee shop coffee made it worth the cost. But customers at Starbucks aren't so sure the tradeoff is worth it anymore. Examining more than 420,000 pieces of feedback across the Quick, Fast, Casual (QFC) industry, including over 21,000 on Starbucks, we find: Starbuck's Purchase Intent 1,2 is down 3% over the past six months, with most of that dip occurring over the past few months. By contrast, Dunkin' Donuts has remained within a tight range over the past six months, as did an average of other, smaller coffee chains. Customers increasingly see less value in Starbucks. Starbuck's Value perception 3 fell 5% over the past six months, compared to just 1% for Dunkin' Donuts. However, it also fell 5% for the average of the smaller coffee chains. Coffee drinkers feel significantly unhappier about Starbuck's quality and taste. Starbuck's Taste perception fell 4% over the past six months, while rising 1% for competitors. Likewise, its Quality perception dipped 3% over the same time period (and 8% over the year). Ultimately, Starbuck's perceived drop in taste is leading inflation-weary consumers to say they plan to spend less at the coffee chain, as the value just isn't as good.
06 May, 2024
Forbes Best Brands for Social Impact, Powered by HundredX
06 May, 2024
Ozempic once dominated the headlines, but GLP-1 competitor Mounjaro is winning over customers. GLP-1 drugs, used for treating diabetes and aiding in weight loss, are relatively new on the market yet have surged in popularity over the last year. They're becoming so popular that J.P. Morgan estimates that 30 million people in the US may be using a GLP-1 drug by 2030. This statistic presents a significant potential for early drug creator Novo Nordisk (Ozempic, Wegovy), and perhaps an even bigger one for Eli Lilly (Mounjaro, Zepbound). HundredX data indicates Eli Lilly is in a position to win over Novo Nordisk as Mounjaro's Usage Intent widens against the competition. Ozempic may have name recognition, but customers feel more positively about Mounjaro's effectiveness and lifestyle impact, even if they aren't excited about its high price. Examining 1,500 pieces of customer feedback across Mounjaro, Ozempic, and Wegovy, we find: GLP-1 users increasingly say they plan to use Mounjaro more, and Ozempic less . Mounjaro’s Usage Intent is up 19% since July, Wegovy’s is up 3%, and Ozempic has stayed within a tight range. Customers feel Mounjaro is more effective than competing drugs, but it’s harder to get . Mounjaro outperforms other GLP-1 drugs in effectiveness, lifestyle impact, and side effects. However, customers dislike its cost and availably more than competitors.
Share by: