The housing market was soft all of 2022, with the National Association of Realtors recently reporting existing home sales fell 34% versus a year ago to a 12-year low in December 2022. The industry has been hurt by rising interest rates, mixed confidence in the U.S. economy, changes to tax incentives and more. Retailers that sell home goods have also been hurt by supply chain issues and cost increases. The Census Bureau reported spending at furniture and home furnishings stores fell by 1% in November 2022 versus a year ago, the first decline in years.
But declining mortgage rates have businesses in housing-related industries hoping for signs things may be bottoming. We look at 450,000 pieces of feedback in the last year from “The Crowd” of real customers of 120 businesses that sell home goods to better understand if 2023 may be better than last year. We find:
- Purchase Intent¹ for Home & Furnishings, Superstores (e.g. Target and Walmart), Discount Stores, and Department Stores have all shown modest increases during the last 2–3 months, after declining for most of 2022.
- Purchase Intent for Home Improvement was flat in December 2022 vs. November 2022, after falling for the prior eight months.
- Home & Furnishings Purchase Intent remains negative and the weakest of the industries that sell home goods (-12%) in December 2022).
- HomeGoods is the current winner among Home & Furnishings brands, with the only positive Purchase Intent (2%) in December 2022.
- Crate & Barrel and The Container Store showed the biggest increases in Purchase Intent during the past three months.
- The most favored Home & Furnishings brands do a great job of satisfying customers with their Selection, Styles, Atmosphere, Store Layout, and Quality.
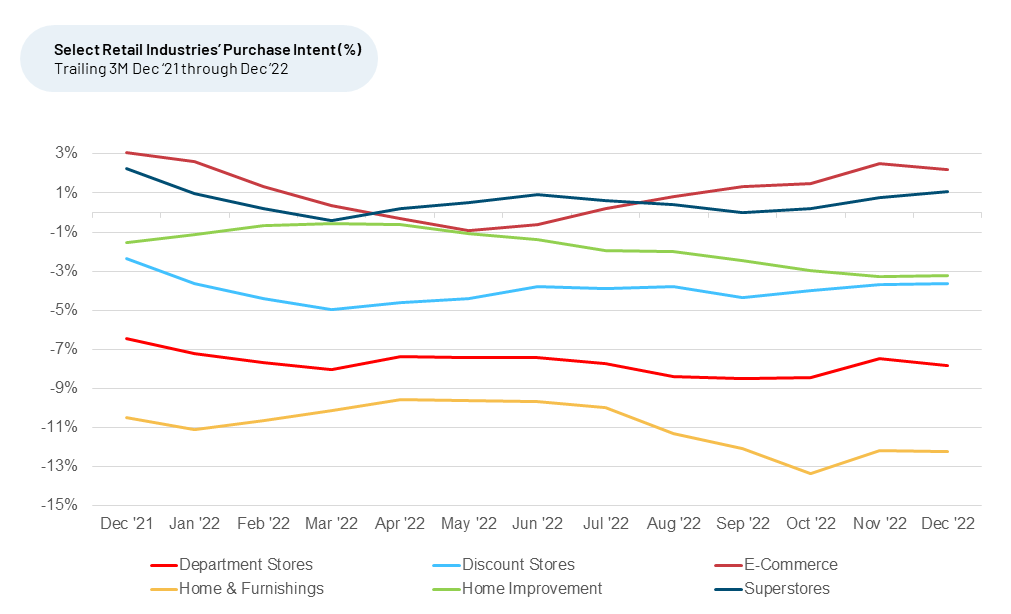
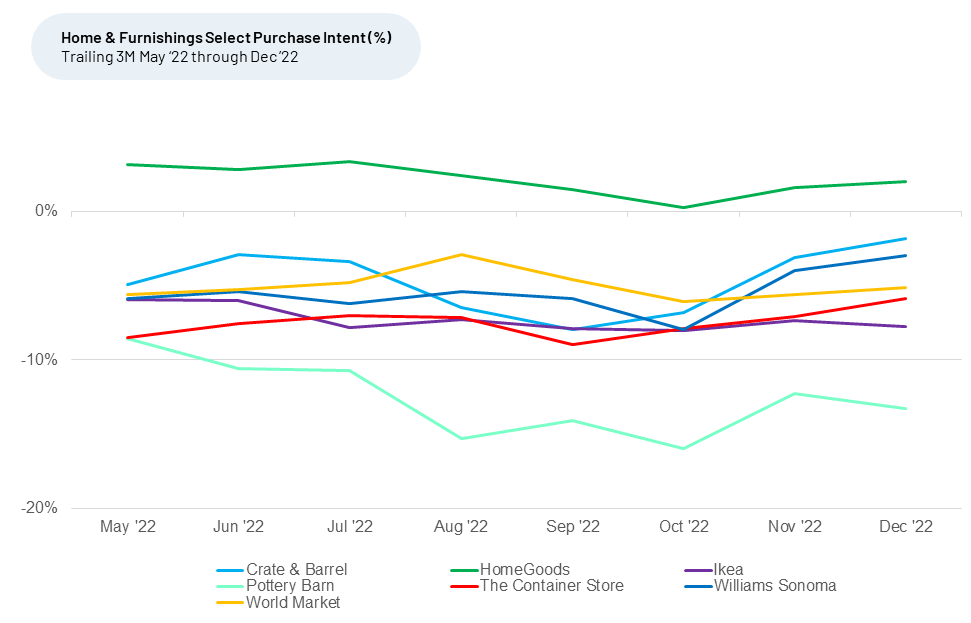
Purchase Intent for Home & Furnishings has begun to recover, with November 2022 the first improvement following a decline to a two-year low in October 2022. December 2022 was flat versus November 2022. Home Improvement’s steady decline in Purchase Intent since April 2022 took a pause in December.
Purchase Intent reflects the percentage of customers who plan to purchase more of a specific brand in the next 12 months minus the percentage that plan to purchase less. We find purchase intent for an industry improving (or weakening) versus other industries has been an indicator of an increase (or decrease) in future market share for that industry.
HomeGoods leads on Purchase Intent for Home & Furnishings
“The Crowd” tells us it’s most positive on spending more of its money at HomeGoods over the next year than with any other Home & Furnishings brand.
HomeGoods Purchase Intent rose modestly from 0% in September 2022 to 2% December 2022. Out of the 40 Home & Furnishings brands covered by HundredX, HomeGoods ranks first in customer satisfaction with Value and second on Price, both top-four drivers of customer satisfaction for the industry.
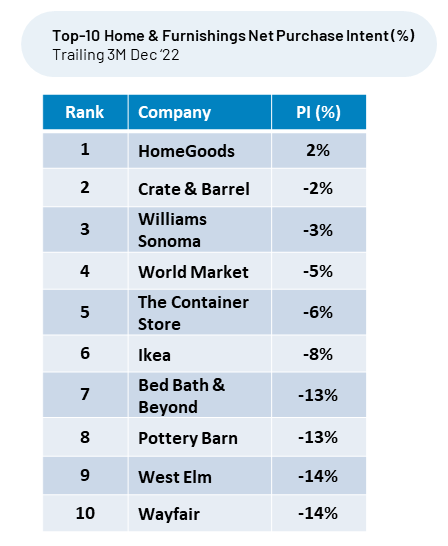
HomeGoods is a sister company to TJ Maxx, Marshalls, and Sierra Trading Post. It focuses on bringing well-known brand deals to upper income families and utilizes a number of social media channels to reach them. One recent satisfied customer told HundredX, “They always have good finds. Quality items at low prices.”
Crate & Barrel is the largest Purchase Intent gainer in Home & Furnishings
Crate & Barrel was the biggest gainer in Purchase Intent during the last three months, December 2022 versus September 2022. We find brands with purchase intent rising faster than the sector average are positioned to gain market share.
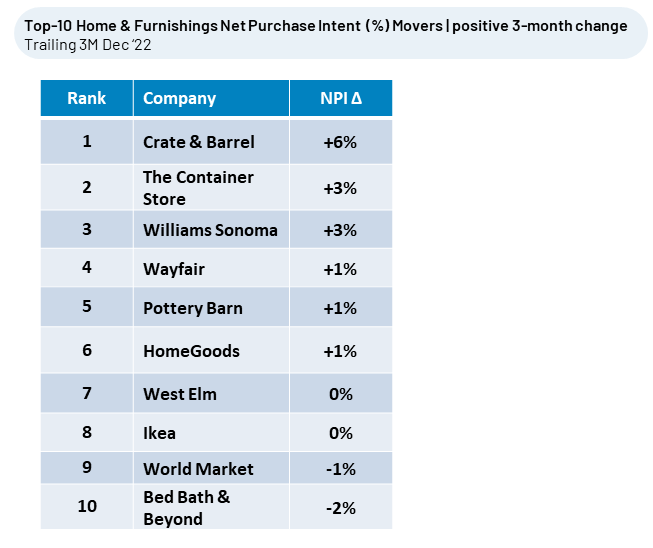
Crate & Barrel’s Purchase Intent rose from -8% in September 2022 to -1% in December 2022. It saw the greatest improvement in customer sentiment towards its Styles, Website, Store Layout and Value during the past three months. Much of this improvement appears to stem from customers giving the company credit for changes it made after Covid-19. Crate & Barrel redesigned the in-store shopping experience and revamped its website and app to be much easier to navigate, focusing on internal data that told them what customers wanted going forward. A customer recently noted, “I appreciate the option to purchase online and pick up in store, especially for those seasonal items that sell out quickly. Love the designs, very modern and clean.”
Top Home & Furnishings Net Purchase Intent movers highlights
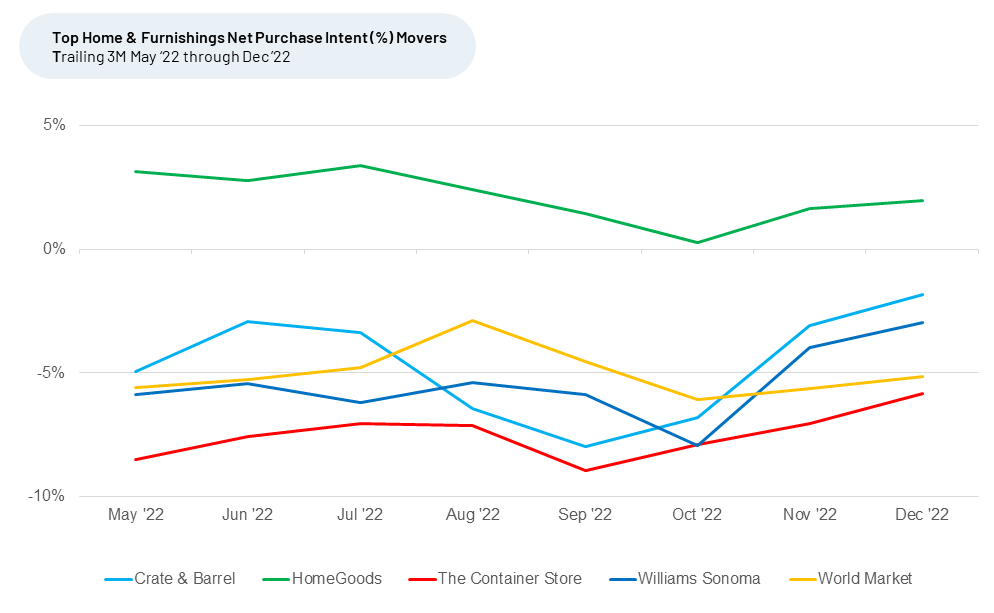
Making customers happy drives market share growth
The Home & Furnishings brands that best navigate the current headwinds and make strides in the areas “The Crowd” says it cares about the most (Selection, Styles, Atmosphere, Store Layout, and Quality) are poised to gain market share in 2023.
HundredX measures sentiment towards a driver of customer satisfaction as the percentage of customers who view a factor as a reason they liked the brand or product minus the percentage who see the same factor as a negative.
- All metrics presented, including Net Purchase Intent (Purchase Intent), and Net Positive Percent / Sentiment are presented on a trailing three-month basis, unless otherwise noted.
Strategy Made Smarter
HundredX works with a variety of companies and their investors to answer some of the most important strategy questions in business:
- Where are customers "migrating"?
- What are they saying they will use more of in the next 12 months?
- What are the key drivers of their purchase decisions and financial outcomes?
Current clients see immediate benefits across multiple areas including strategy, finance, operations, pricing, investing, and marketing.
Our insights enable business leaders to define and identify specific drivers and decisions enabling them to grow their market share.
Please contact our team to learn more about which businesses across 75 industries are best positioned with customers and the decisions you can make to grow your brand’s market share.
####
HundredX is a mission-based data and insights provider. HundredX does not make investment recommendations. However, we believe in the wisdom of the crowd to inform the outlook for businesses and industries. For more info on specific drivers of customer satisfaction, other companies within 75+ other industries we cover, or if you'd like to learn more about using Data for Good, please reach out: https://hundredx.com/contact.
Share This Article