Downward demand growth trends anticipated to continue across Travel sectors, except Cruises.
Each month, the HundredX team analyzes trends we see across the Travel industry. This report breaks down the latest insights gleaned from thousands of real customers (“The Crowd”), who provide feedback to HundredX via our proprietary listening model. We look at more than 240,000 pieces of customer feedback on more than 125 companies across six subsectors of travel since August 2021. We dig into the metrics that highlight future purchase and usage intent, the drivers behind changes in intent, customer satisfaction, as well as trends and anomalies across industries including Cruise Lines, Airlines, Hotels, Casinos & Resorts, Car Rentals, and Booking Sites. In addition, we highlight select businesses that are winning with customers in these sectors..
This month in Travel: September 2022 Update
- Future Net Purchase Intent (NPI) continues to fall for the Travel Industry overall.
- Demand growth outlook for Cruise Lines continues to be robust, based on NPI, outpacing all other Travel subsectors.
- Consumer sentiment toward price remains mixed, but continues to favor Hotels and Cruise Lines.
Monthly Recap
“The Crowd” — real customers who share immediate
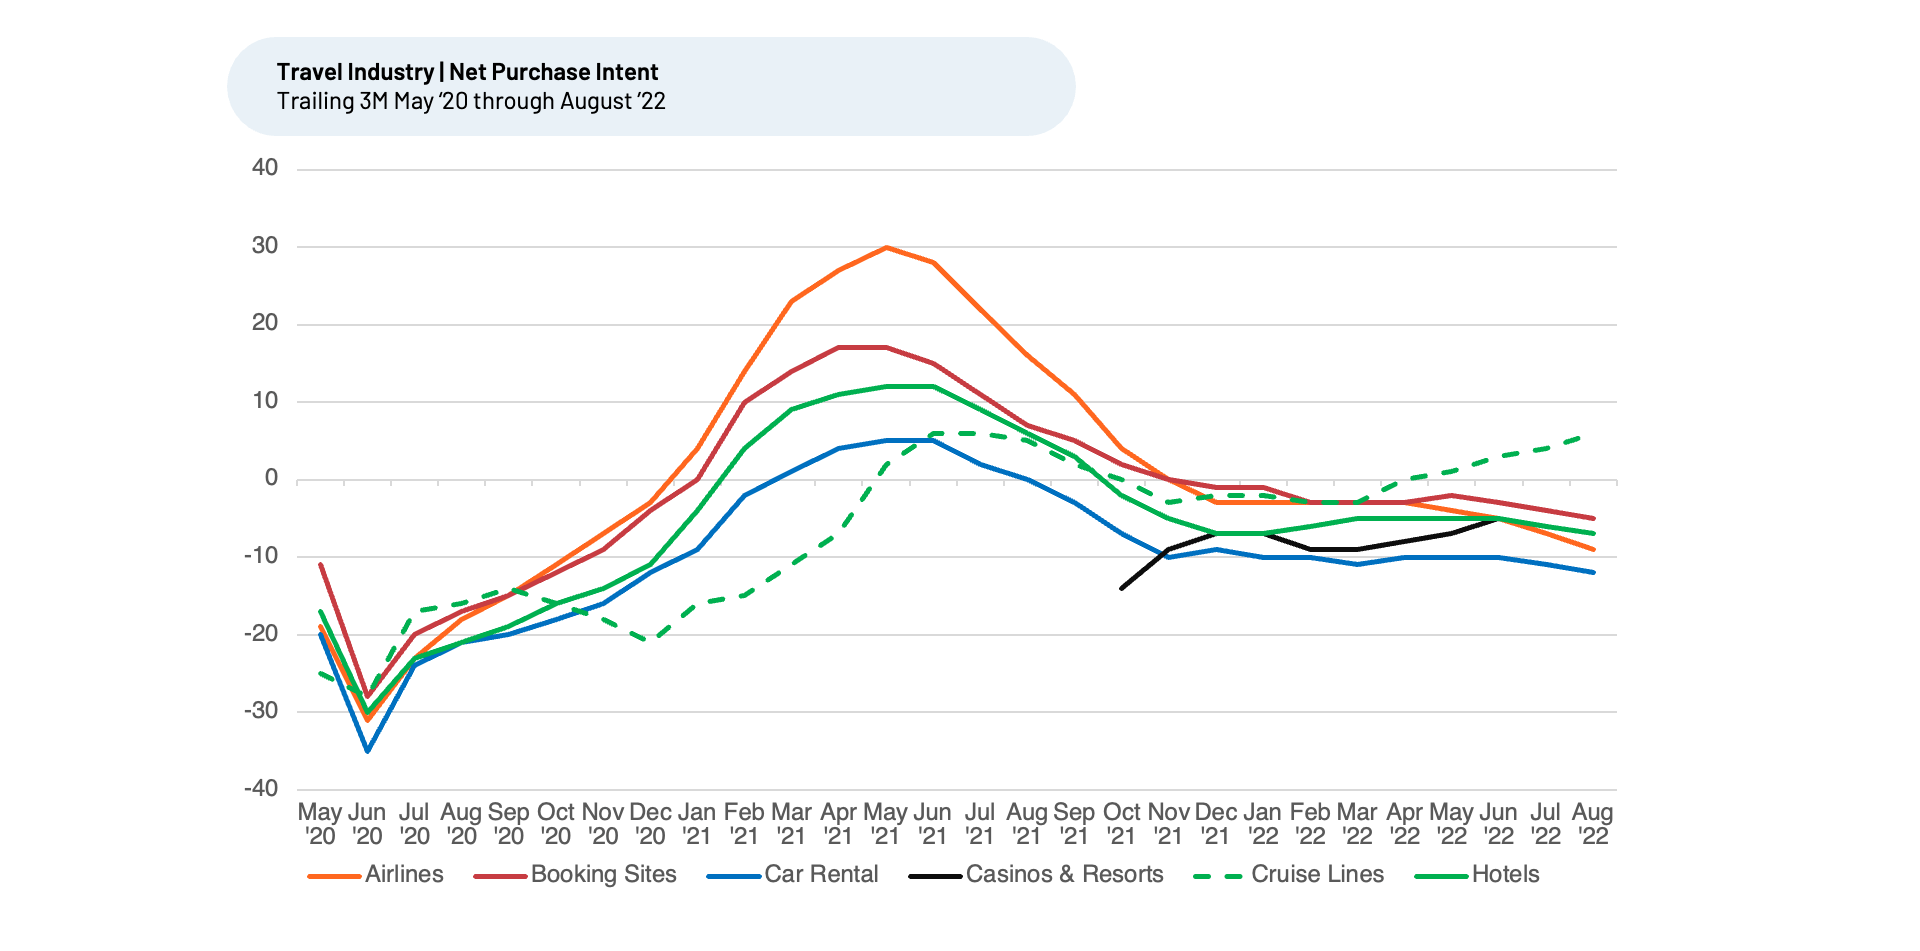
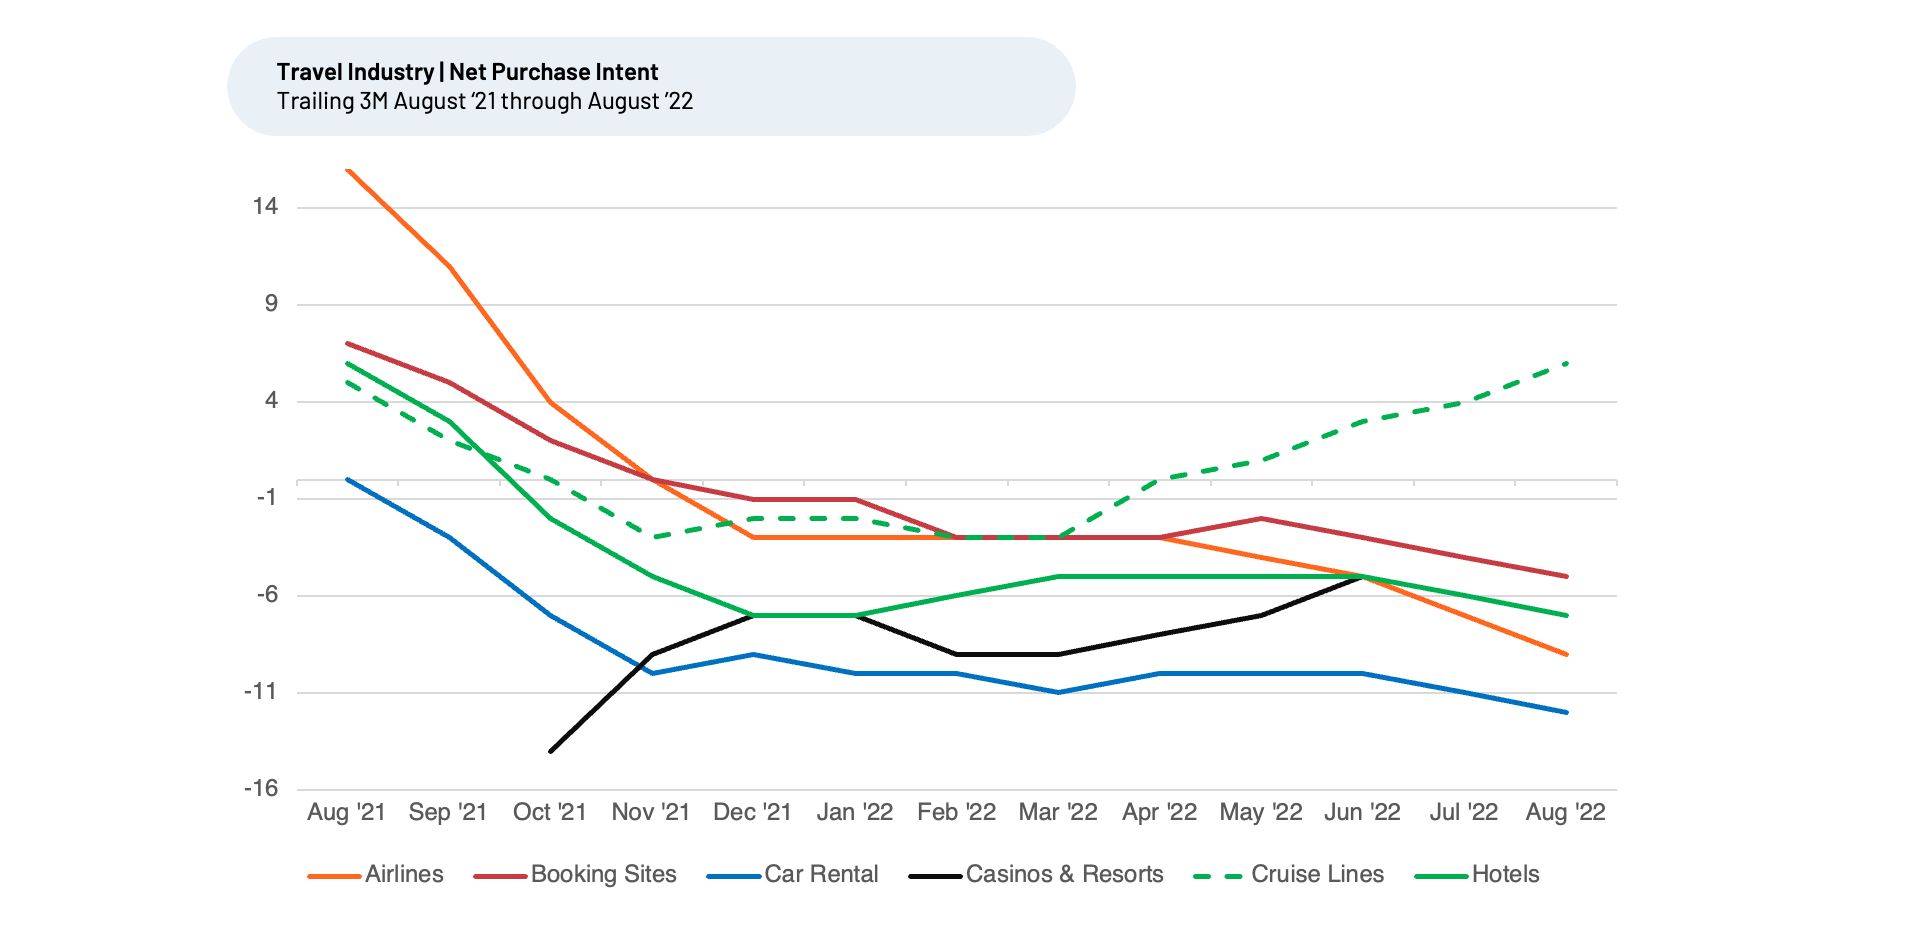
feedback with HundredX — indicates we should see continued downward demand growth trends for most of Travel, as reflected in the decline we observe in future Net Purchase Intent (NPI) for August 2022 vs. July 2022 for every sector we follow except for Cruises. NPI reflects the percentage of customers who plan to use a given business to travel more during the next 12 months minus the percentage that plan to travel less. NPI for Cruise Lines, which essentially dropped off a cliff beginning spring 2020, has outpaced the entire Travel industry by a wide margin during the past six months and continues its unique upward trend.
As inflation and economic uncertainty remain widespread, we anticipate that these macro factors will continue to affect demand growth for the overall Travel sector, including the upcoming holiday period. Expected year-ahead inflation declined this month, helped by a continued drop in gas and energy prices, the lowest reading since last September. However, it remains to be seen if these factors will continue to help, as consumer sentiment remains an issue.
This economic uncertainty appears to be affecting overall demand growth across most travel sectors, except for Cruise Lines. Based on analysis of feedback to HundredX, consumers appear to be more satisfied with pricing for cruises compared to other areas of travel. Cruise prices are currently at historic lows, which has helped spur bookings, as the sector looks to draw back business after its extended slump. Cruise NPI has risen 9%, from -3% for T3M March 2022 to 6% for T3M August 2022, the only positive travel sector. The other travel sectors have all seen NPI fall by 2% to 6% over the same time period, and all are negative as of August 2022. Airlines has fallen the most, from -3% for T3M March 2022 down to -9% for T3M August 2022.
The increase we have seen in NPI for Cruises over the last six months aligns with the surge the industry has seen in bookings for the largest publicly-traded companies (Carnival, Royal Caribbean, and Norwegian). Insights from “The Crowd” lead us to believe we should see bookings growth for cruises continue at least through year end. We will continue to watch the trends in our data and results closely.
Consumer spending on cruises hit bottom in 2020, as the industry was almost completely shut down by COVID outbreaks and numerous regulations that extended into July 2022. While most other businesses throughout the world were able to recover faster without such stringent rules, cruise lines did not operate at all or in a very limited capacity from March 2020 – July 2022. According to cruise earnings reports and Statista, total cruise revenues dropped from $27 billion in 2019 to $3 billion in 2020. By 2021, total revenue recovered to $13 billion. The three largest publicly-traded cruise company reported revenue growth of 80% or the latest quarter versus the prior one. The current NPI trends indicate those growth rates should be sustained through at least year end.
Divergent price trends the biggest reason Cruise demand growth outpacing rest of Travel
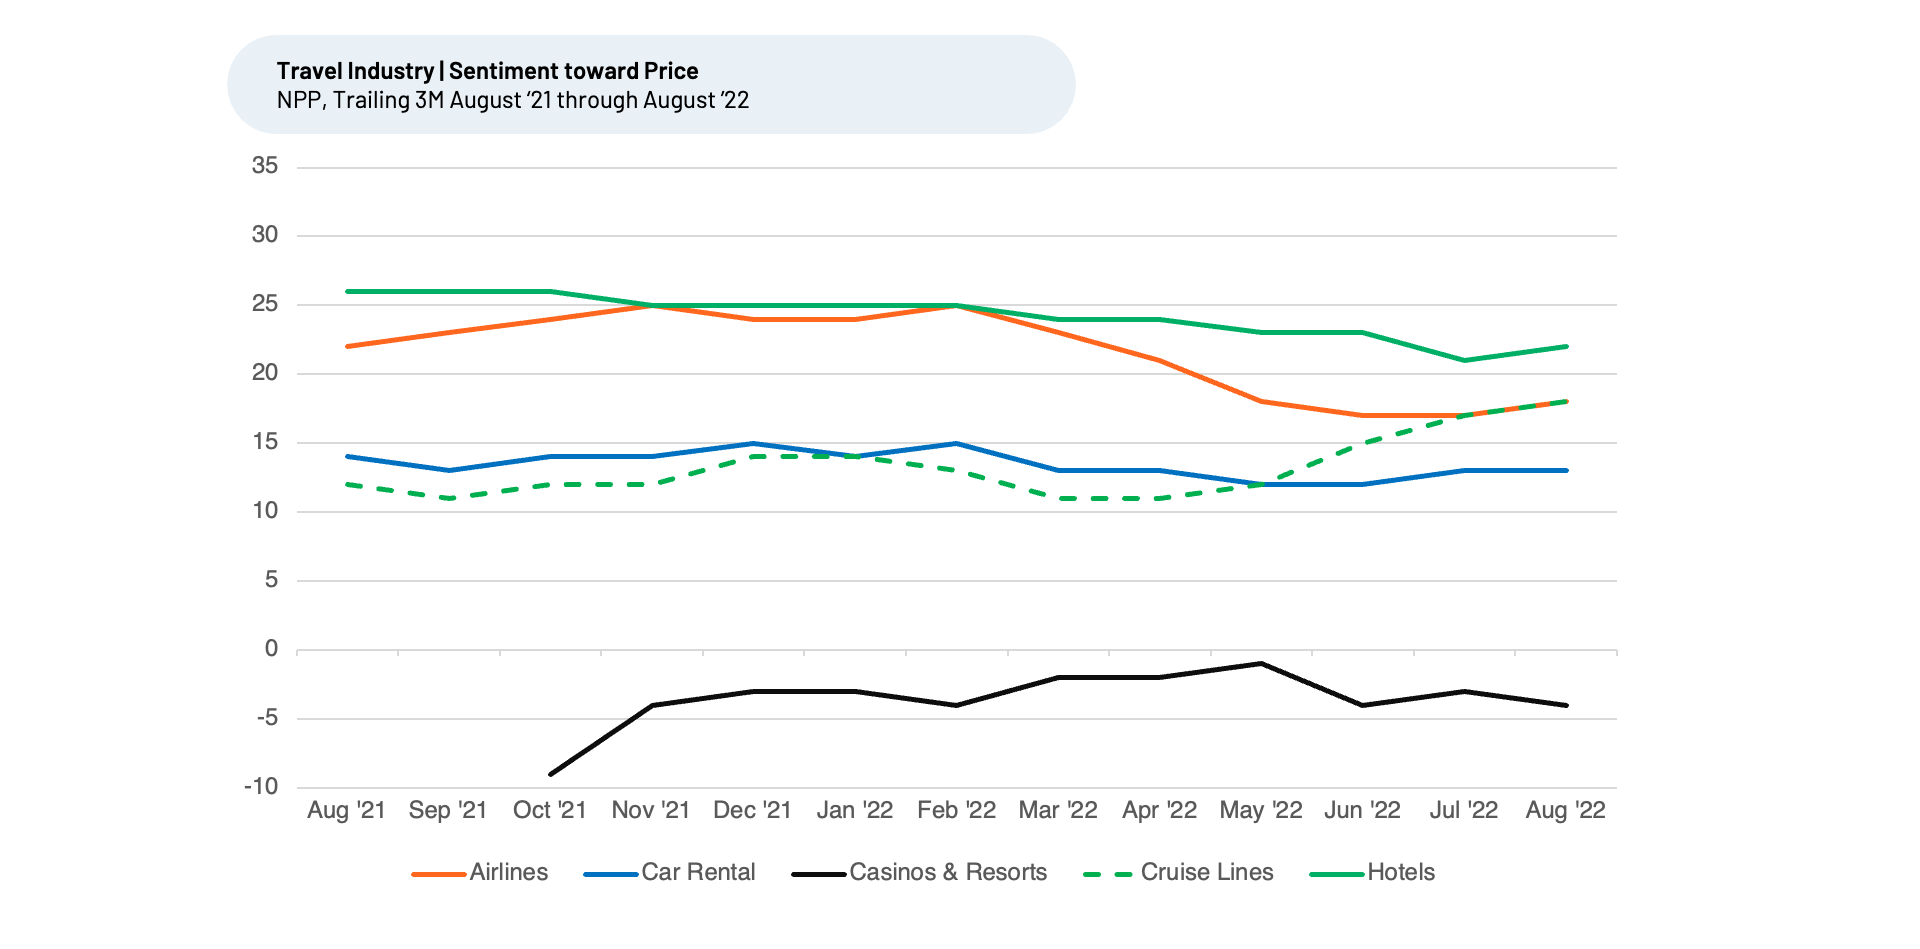
With inflation pressuring most supply chains and businesses, prices have increased in many industries. For example, Airline tickets have risen 25% for the year, Hotel rooms 15%, and Car Rentals up to 25% higher as companies pass through many inflationary expense increases directly to consumers. Consequently, consumer sentiment toward Price, measured by Net Positive Percentage (NPP) remains mixed for the Travel sector. NPP represents the percentage of customers who selected a factor (or driver) as a reason they liked a product or service minus the percentage who saw it as something they did not like.
HundredX’s data shows the cruise industry’s NPP beginning to shift in March 2022, and then outpacing change in for other industries during the next six months. Cruise NPP for “Price” has risen 7%, from 11% for T3M March 2022 to 18% for T3M August 2022. The other travel sectors are all flat to down 5% over the same time period. Airlines has fallen the most, from 23% for T3M March 2022 down to 18% for T3M August 2022. We note, Airlines NPP did edge slightly higher from 17% for T3M July 2022.
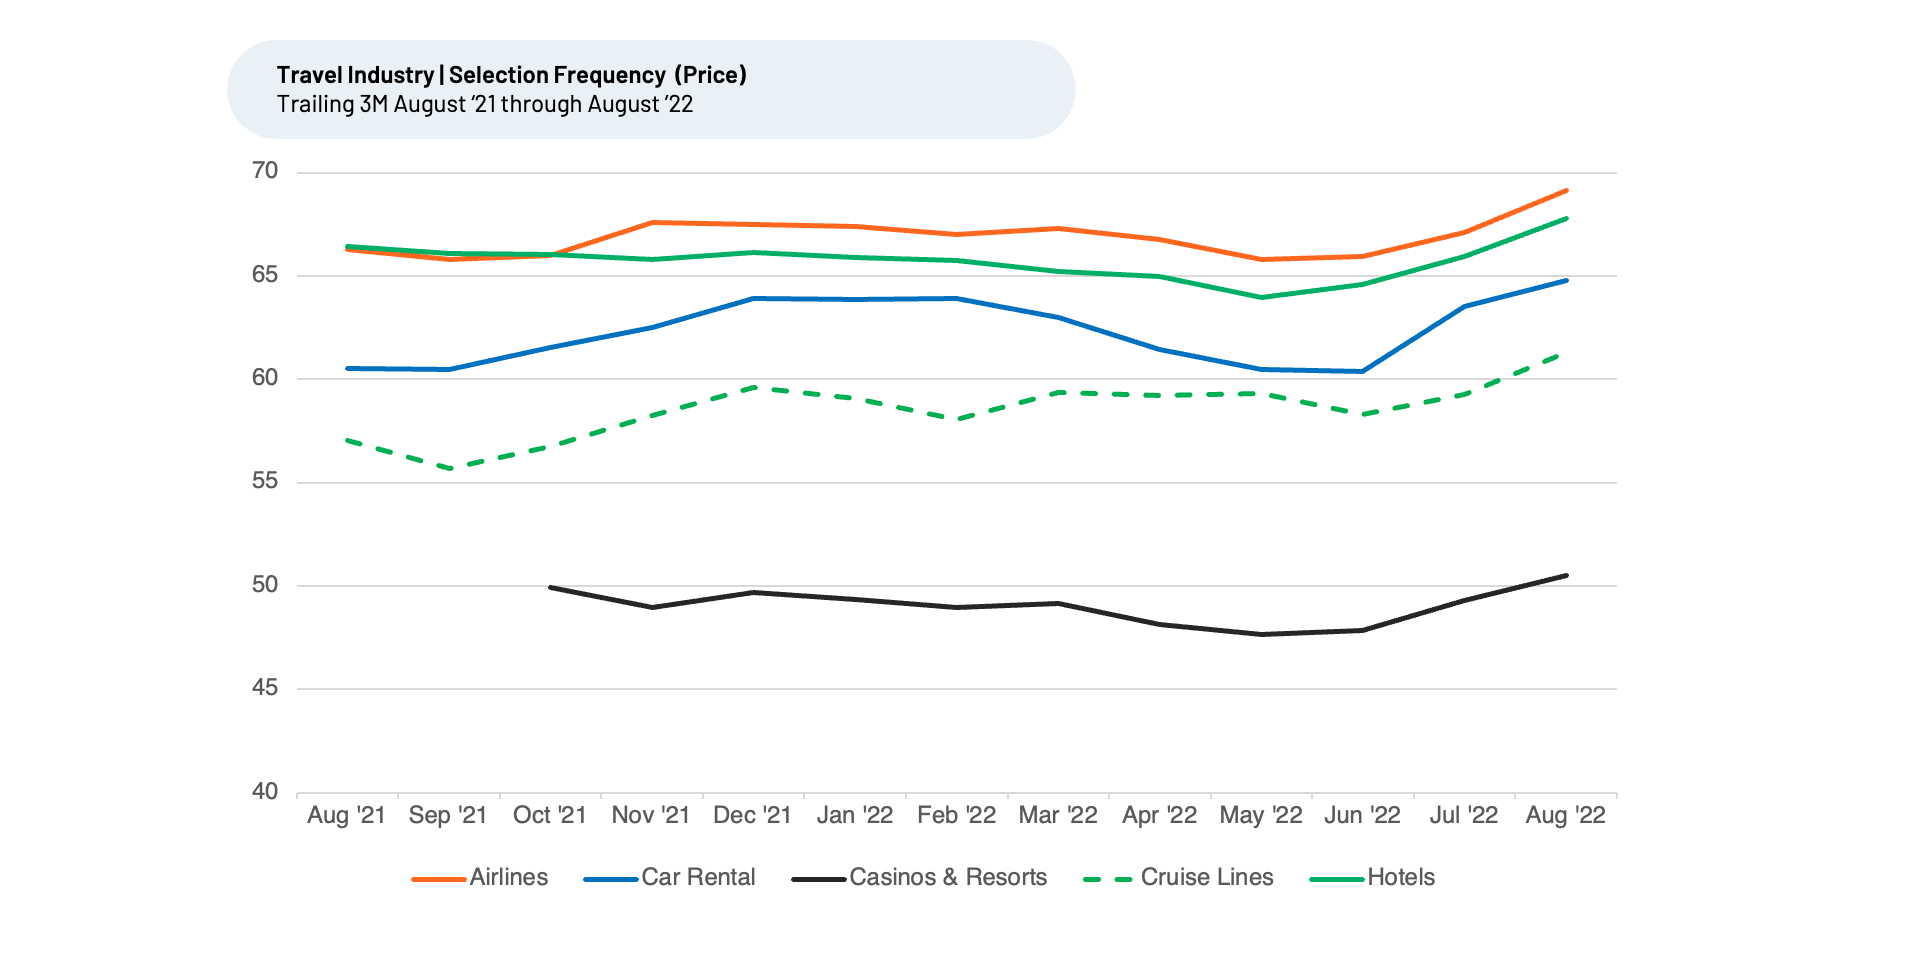
An analysis of how often consumers select “Price” as reason they do or do not like a travel brand’s offering indicates price is increasing as a consideration for all travel sectors and is an even more important factor for Airlines, Hotels, and Car Rental businesses than it is for Cruise Lines and Casinos & Resorts. Customers selected “Price” as a driver 69% of the time they shared their feedback on airlines with HundredX during the T3M August 2022, the highest of all industries and up from 66%-67% for most of the August 2021 to May 2022 period. This is well ahead of the 61% of the time consumers chose “Price” as an important factor in their satisfaction with cruises for T3M August 2022.
Recovery from COVID restrictions also key driver for cruises
Cruise Lines felt COVID’s impact perhaps more than any other Travel segment. However, rules put in place two years ago are finally beginning to change.
- In July 2022, the CDC dropped its official COVID guidance for cruise operators, one of many recent changes helping to boost growth as things begin to return to pre-pandemic normality, well behind most other sectors.
- In September 2022, most cruise operators further adjusted pre-trip testing and vaccination requirements, making it easier to book, embark, and travel to various destinations.
- Many lines have announced that during the next couple of months fully vaccinated guests will no longer need a negative COVID-19 test to travel. Guests who are not fully vaccinated can now provide proof of a negative test one to three days before embarking, and they are no longer required to take a second test at the terminal the day of ship travel.
More and more destinations also continue to open, or have announced they will soon, further helping cruise lines draw customers.
Business factors we see potentially supporting recent Cruise outperformance
It is notable that, while NPI for Cruise Lines has surged, Customer Satisfaction (CSAT), which HundredX measures on a 5-point scale, has remained relatively flat at 4.2 for the entire cruise industry since December 2021. Cruise Lines are tied with Hotels, which also has a CSAT of 4.2 as of August 2022, to lead all Travel sectors. This measurement hasn’t changed as much as NPI over time, indicating the demand growth acceleration for cruises is more likely driven by the macro factors we have discussed than business or industry-specific factors executives have more control over.
That said, to understand why Cruise Lines leads the Travel competition with respect to both customer satisfaction and customer intent to spend more, we dig into specific purchase intent drivers to uncover “the why behind the buy." We examine Cruise Lines performance on the 16 drivers of customer satisfaction we track for the broader Travel industry. In the most comparable areas, Price, Food & Beverage, Entertainment, Staff Attitude, Atmosphere, and Quality rank as the most selected and most important factors for travelers. Cruise Lines wins on these, delighting the crowd by receiving better marks than the broader industry. Significant improvements for sentiment towards Entertainment, Staff Attitude and Atmosphere in particular the last three months indicate they could be at least partly responsible for the increase in cruise industry demand growth.
Entertainment
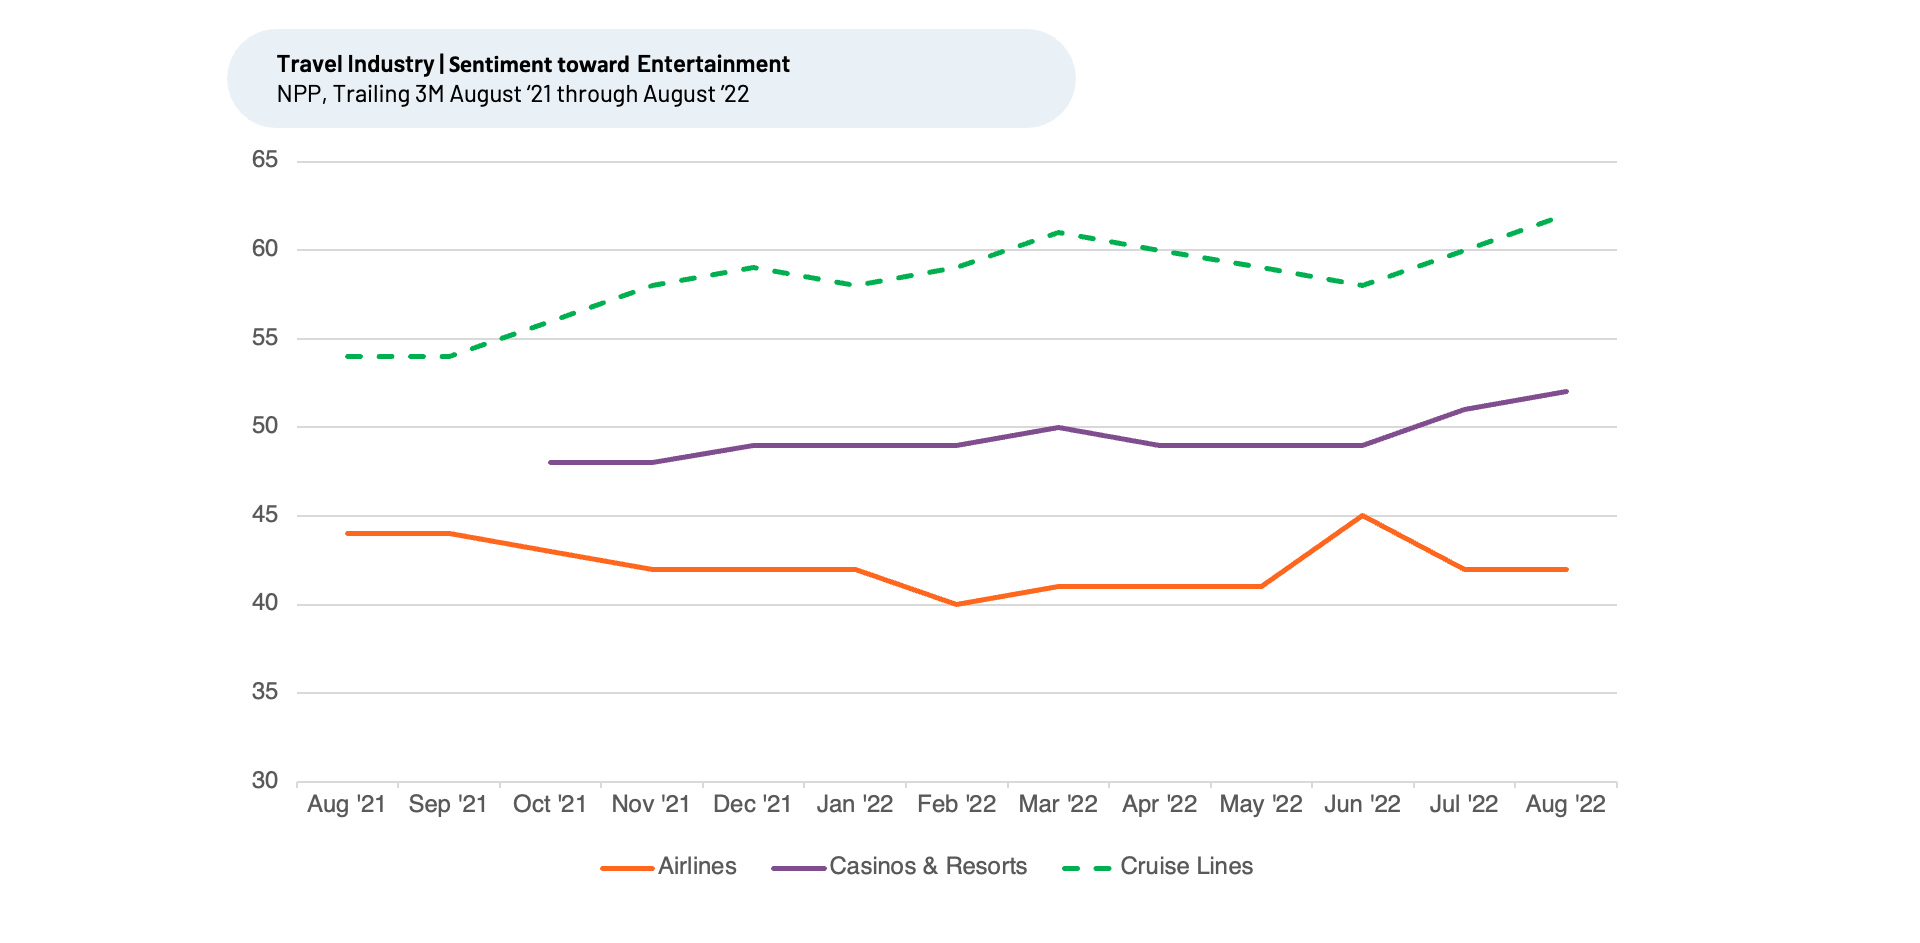
Entertainment is a major reason why people go on cruises and a significant area of investment for the companies. “The Crowd” has noticed, with Cruise Lines remaining in the top position for satisfaction among Travel since at least August 2021. Cruise NPP for Entertainment has surged the most this year, from 54% for T3M January 2022 (vs. 49% for the peer group) up to lead the group at 62% for T3M August 2022 (vs. 52% for the peer group).
One recent customer commented, “Carnival Cruise has great entertainment options. I liked that they offered more comedy shows and other entertainment in addition to main nightly shows. My first cruise was with another line, and after cruising with Carnival, I have never cruised with anyone else. They provide good value for the price, and better entertainment.”
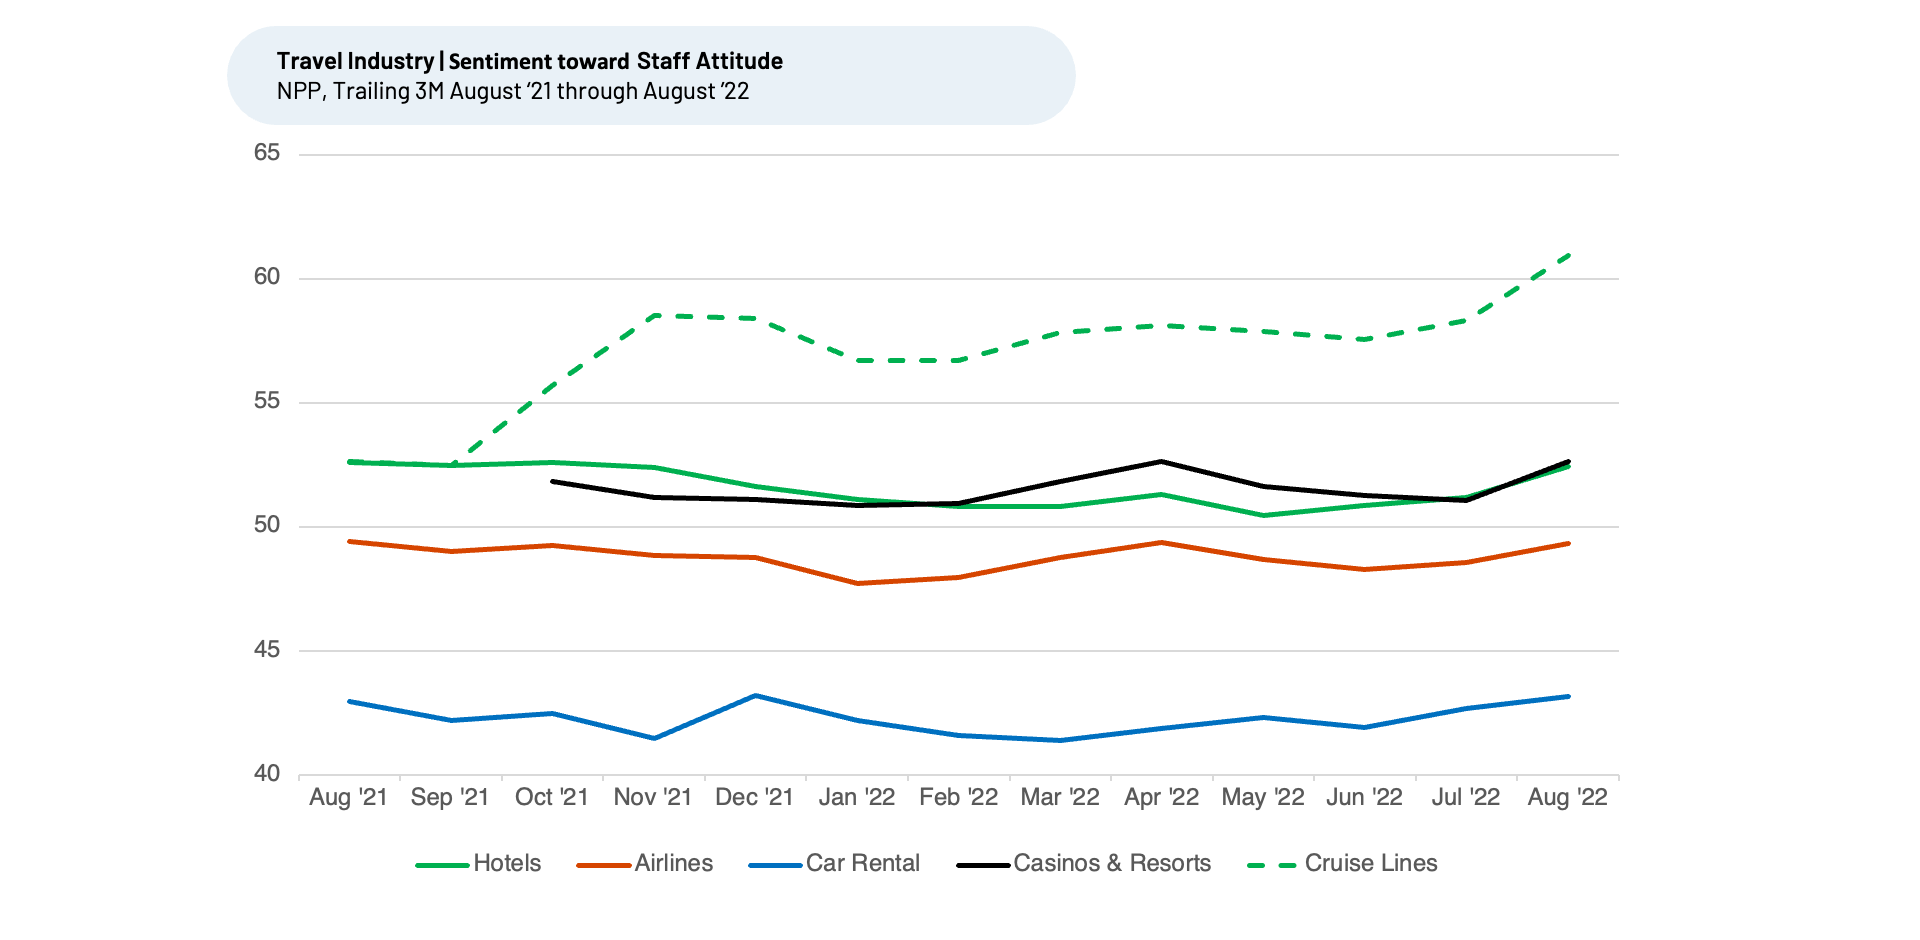
Staff Attitude
Another key differentiator, Staff Attitude, plays a key role in where customers choose to spend their time. Again, we see Cruise Lines posting a significant uptick in sentiment this year, far above other sectors. Cruise NPP for Staff Attitude has surged the most this past year, from 53% for T3M August 2021 (vs. 50% for the peer group) up to lead the group at 61% for T3M August 2022 (vs. 52% for the peer group).
Customers are taking note of cruise line’s efforts to improve the overall experience, “We cruise frequently as a family and while Carnival is seen as a discount cruise line, I have to say that I really prefer them over other lines. The staff is always overly friendly, especially to my kids.”
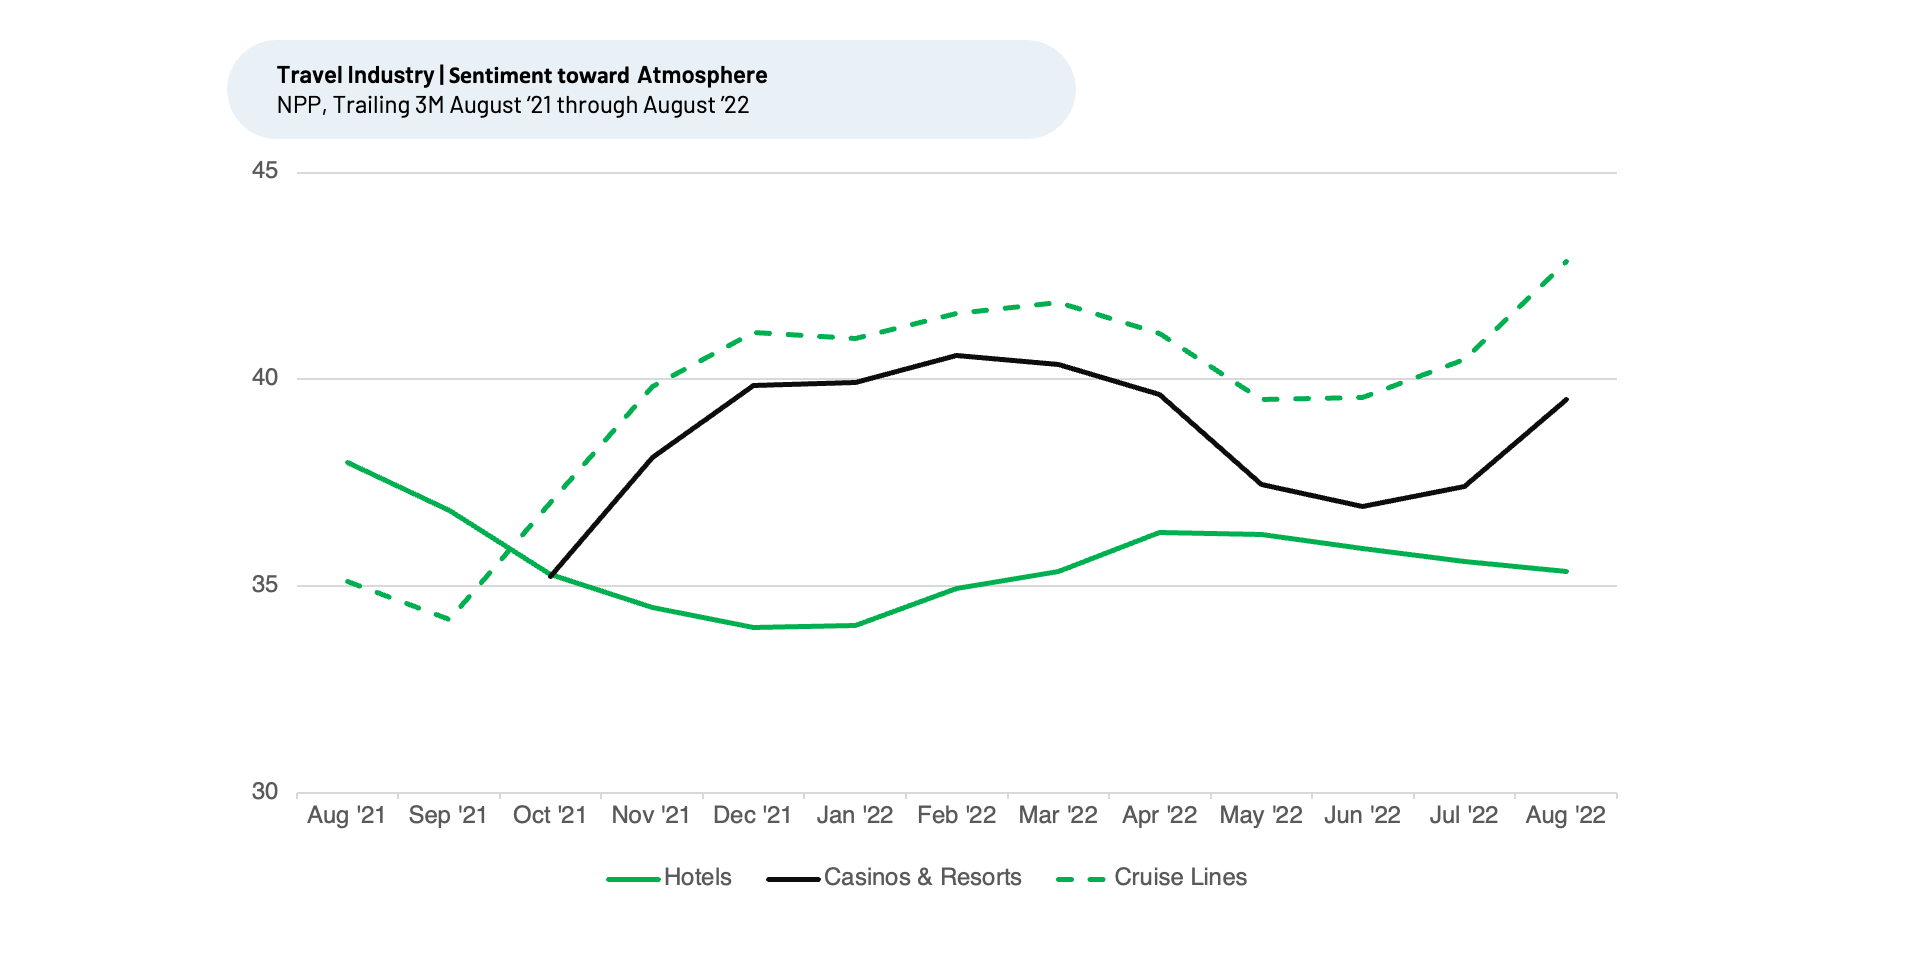
Atmosphere
Cruise Lines are also beating out other Travel sectors in sentiment towards for Atmosphere. Cruise Line NPP for Atmosphere has surged the most this year, from 35% for T3M August 2021 (vs. 36% for the peer group) up to lead the group at 43% for T3M August 2022 (vs. 39% for the peer group).
Cruise lines realize they need to work harder, especially to catch up with other sectors after COVID. Their emphasis on a better Atmosphere and overall experience seems to be making a difference.
A recent cruise customer commented, “I got married using a cruise and cannot wait to go again. We felt like royalty. Loved the atmosphere.”
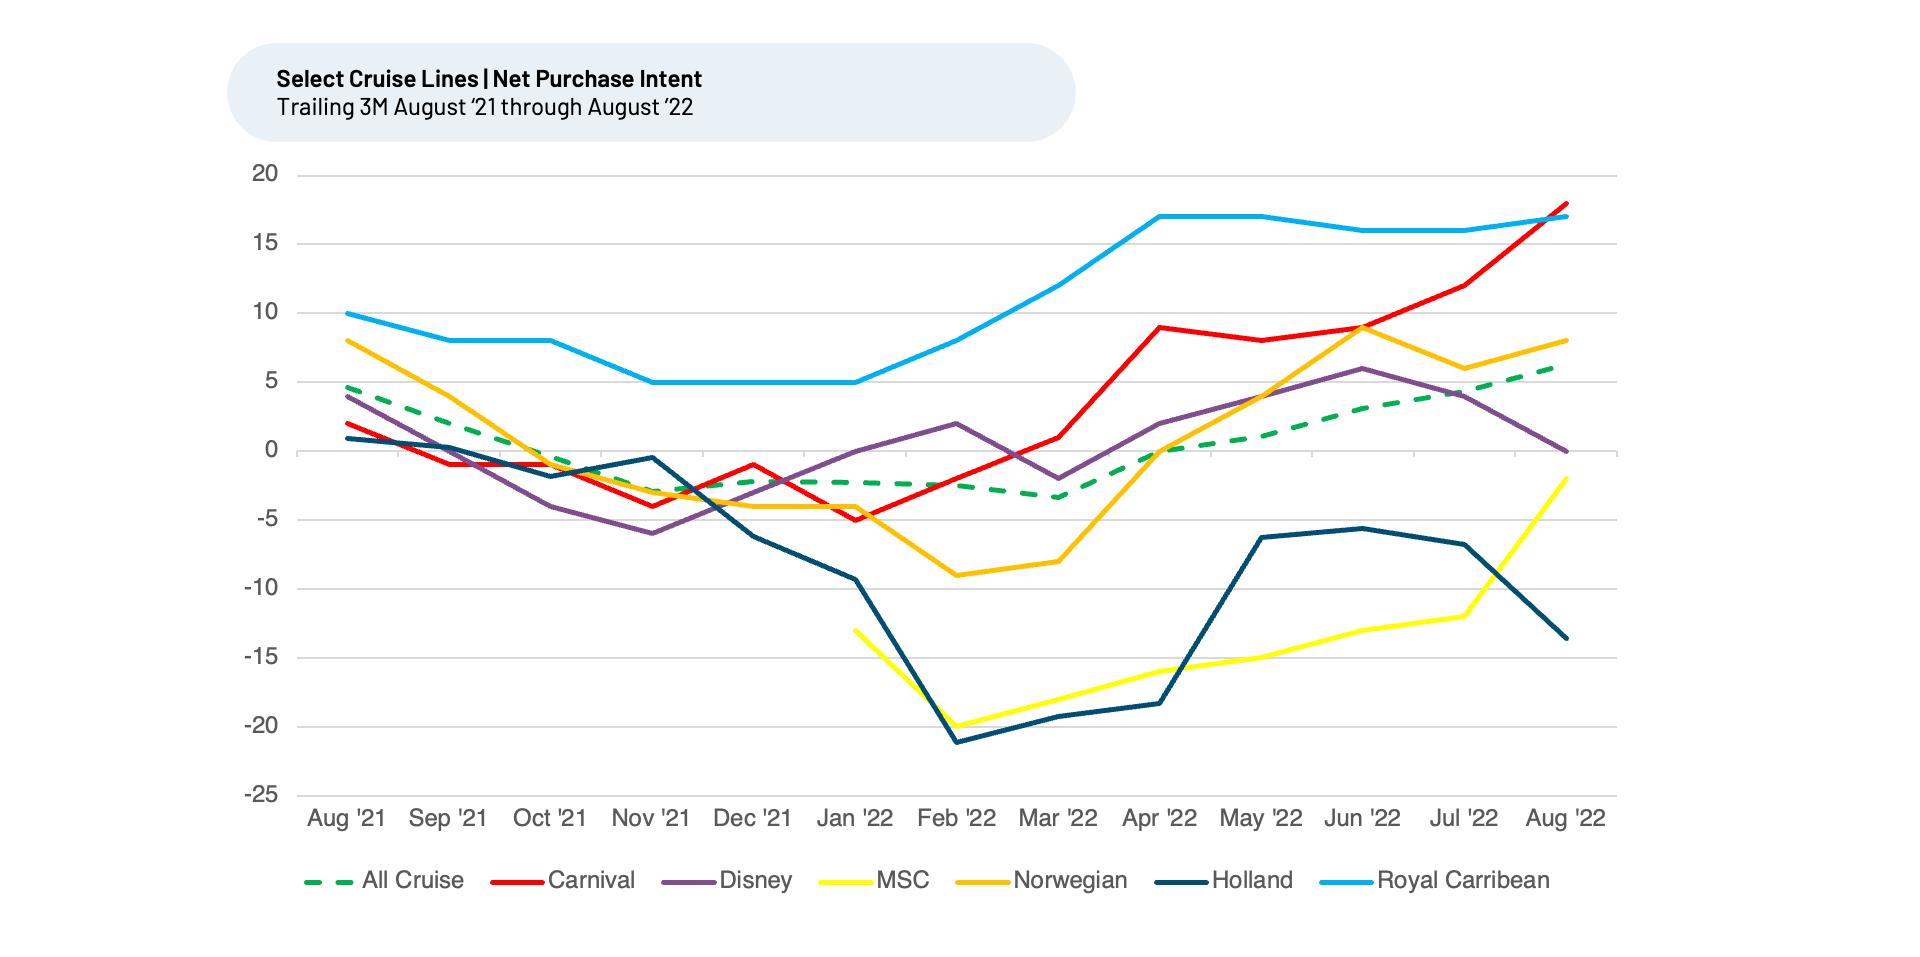
Carnival appears poised to gain share in the Cruise industry
While the cruise industry as a whole appears poised to sustain solid booking growth in contrast to the rest of travel, Carnival stands out in particular — NPI has surged the most this year, from a below average -5% for T3M January 2022 (vs. -2% for the peer group) up to lead the group at 18% for T3M August 2022 (vs. 6% for the peer group).
“The Crowd” tells the cruises businesses that enjoy the best Customer Satisfaction (CSAT) tend to do a better job than their peer group at delighting customers on Food & Beverage, Entertainment / Activities and Price. Carnival’s surge in NPI aligns with a relative improvement in sentiment towards Food & Beverage and sustained dominance in sentiment toward Price.
For more details on the specific drivers making a difference for Carnival and others, please reach out to us.
With inflationary and other economic uncertainty weighing on the economy, The Crowd indicates that intent to purchase within Travel is soft and demand growth for the space is likely to continue its downward trend. Purchase intent and sentiment toward Cruise Lines remains a bright spot within the industry, driven by attractive pricing, a recovery from COVID restrictions and a great job keeping customers happy with its Entertainment, Staff Attitude and Atmosphere. HundredX data indicates Cruise demand growth should continue to outpace the rest of Travel through at least the end of the year.
Strategy Made Smarter
HundredX works with a variety of companies and their investors to answer some of the most important strategy questions in business:
- Where are customers "migrating"?
- What are they saying they will use more of in the next 12 months?
- What are the key drivers of their purchase decisions and financial outcomes?
Current clients see immediate benefits across multiple areas including strategy, finance, operations, pricing, investing, and marketing.
Our insights enable business leaders to define and identify specific drivers and decisions enabling them to grow their market share.
Please contact our team to learn more about which businesses across 75 industries are best positioned with customers and the decisions you can make to grow your brand’s market share.
####
HundredX is a mission-based data and insights provider. HundredX does not make investment recommendations. However, we believe in the wisdom of the crowd to inform outlook for businesses and industries. For more info and metrics on the cruise sector as well as 75+ other industries, or if you'd like to understand more about using Data for Good, please email info@hundredxinc.com.
Share This Article