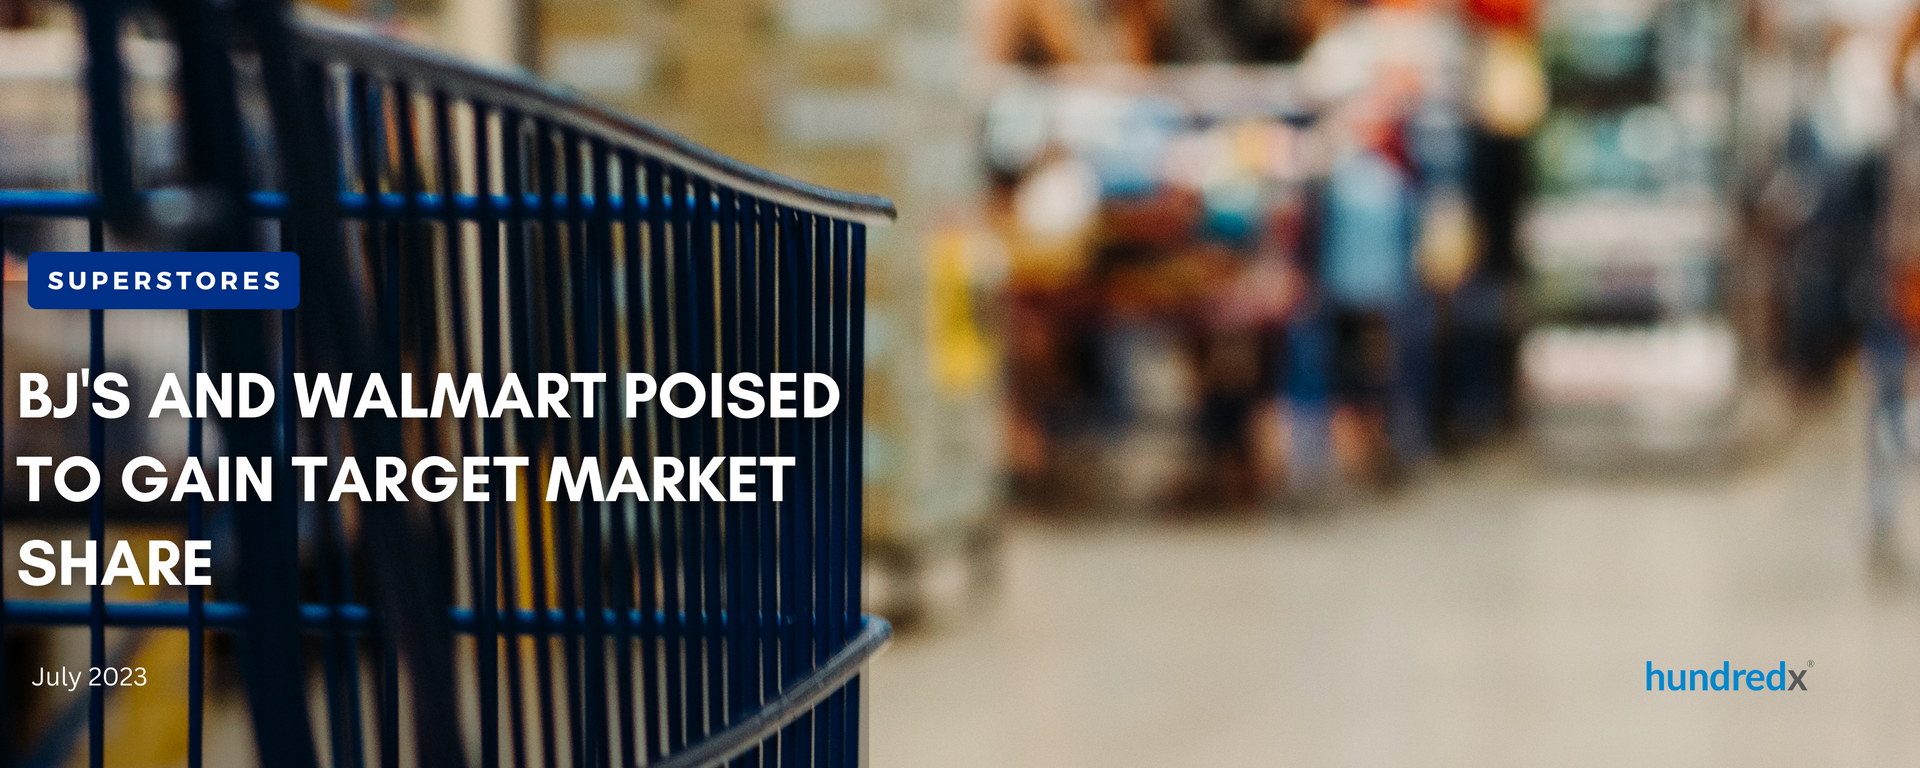
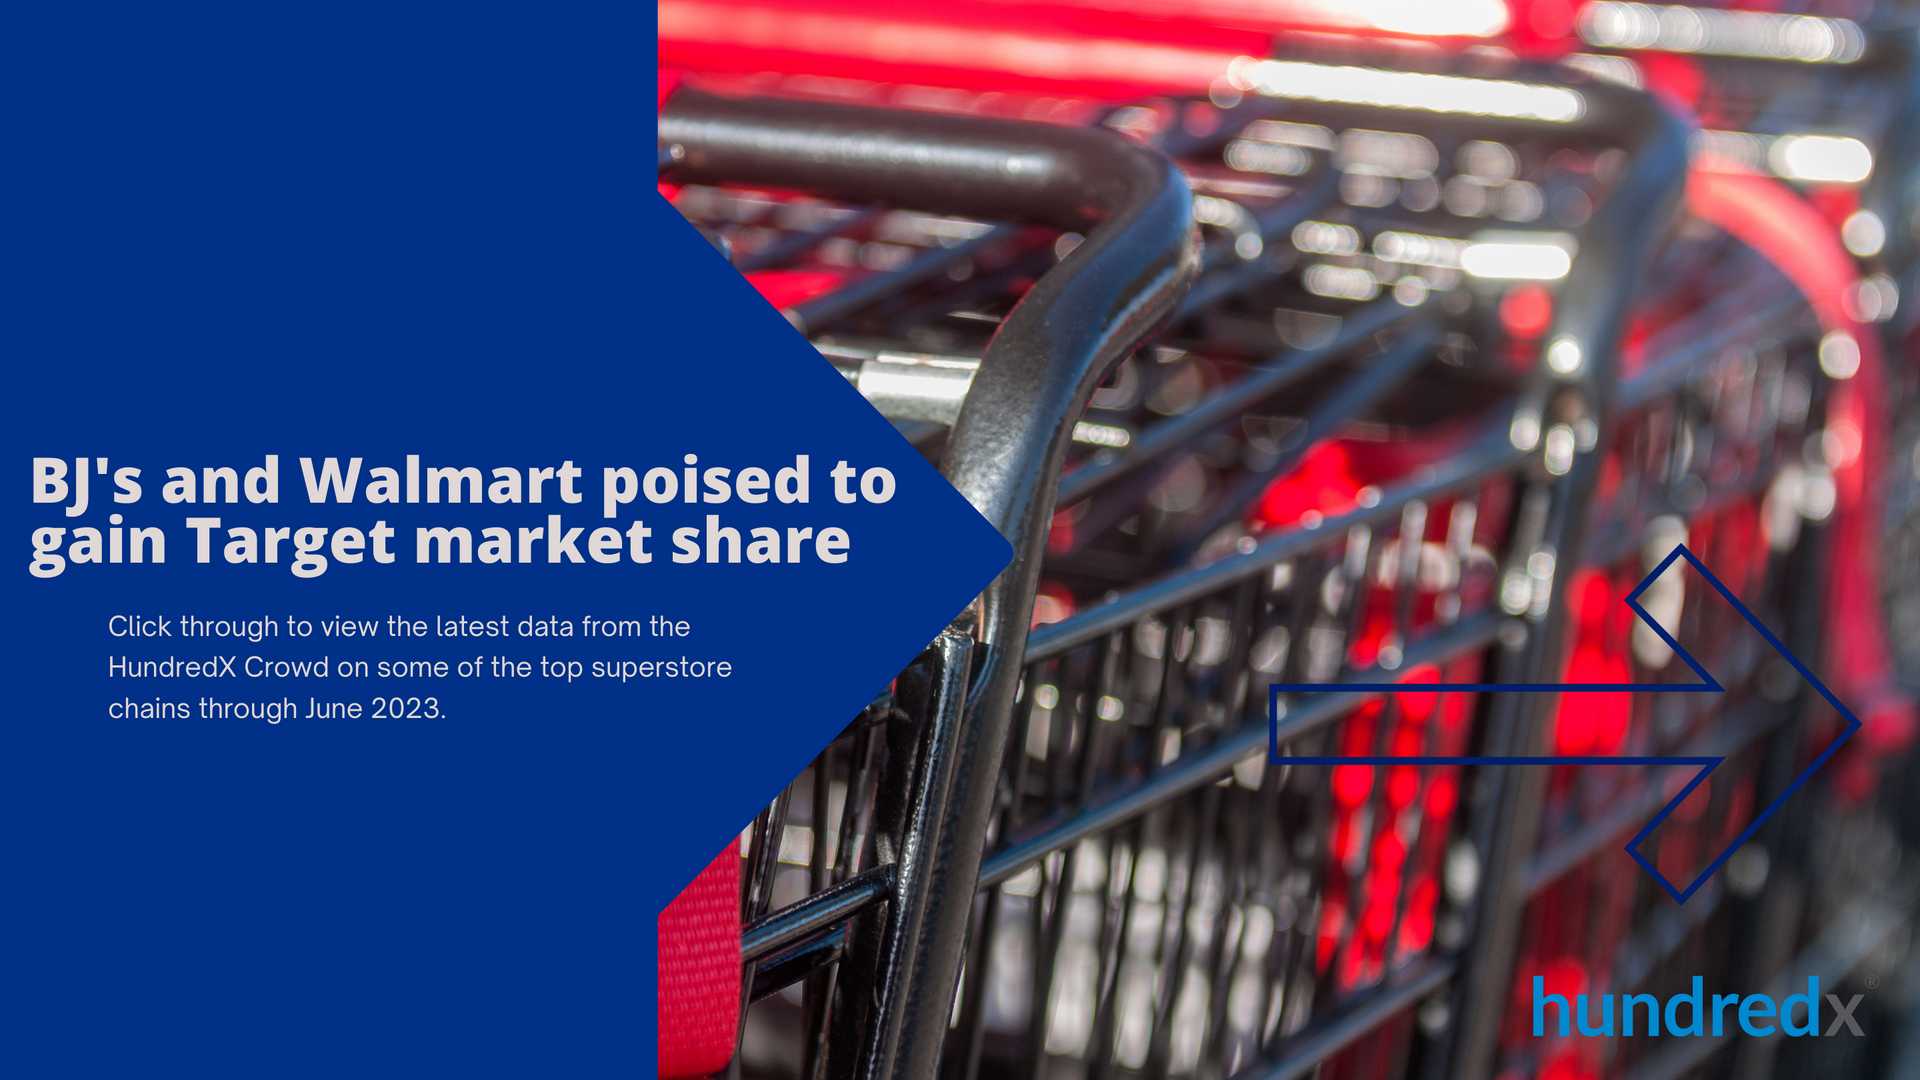
HundredX recently analyzed trends in customer sentiment for Target versus competitors through June 2023. The analysis draws on over 150,000 pieces of continuous, double-blind customer feedback across Superstores during the past year, including over 45,000 and 50,000 for Target and Walmart, respectively. 

Key Takeaways:

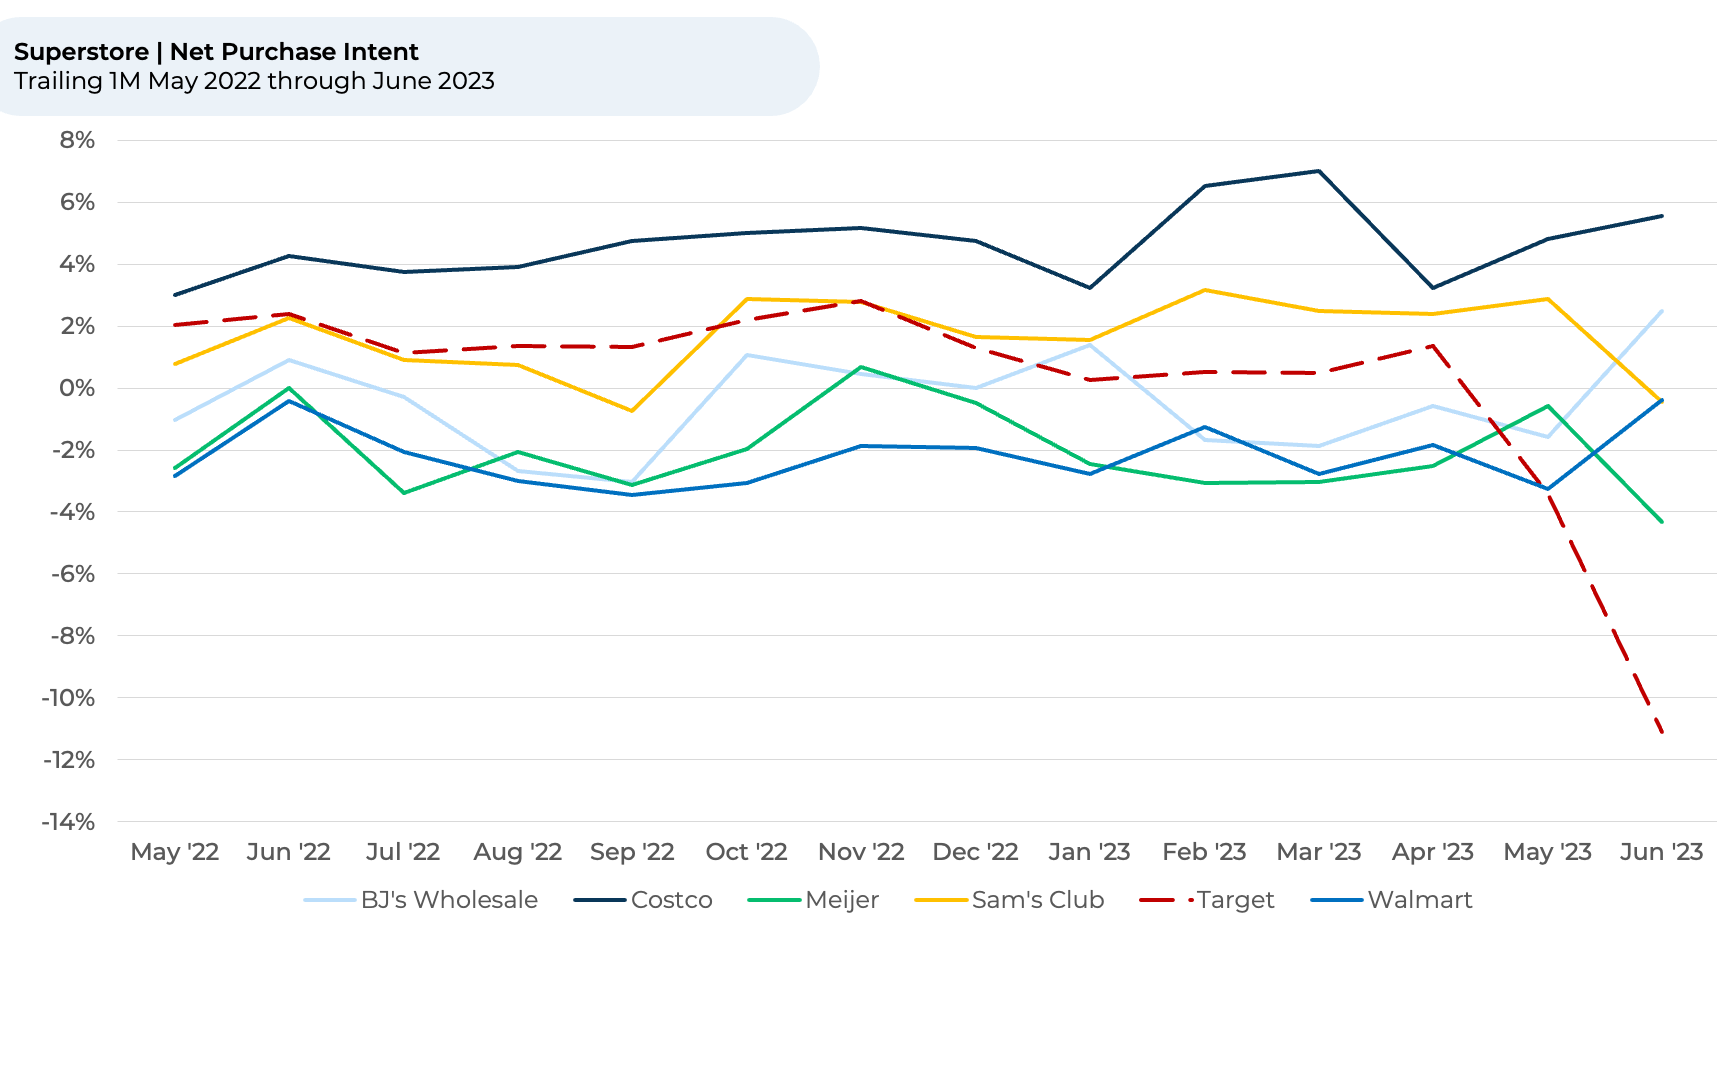
  • Future Demand Outlook: Target customer future purchase intent1,2 started to fall in May and has accelerated through June.  Overall, net future spending intent has declined 13% from April through June (8% of which occurred in June). 


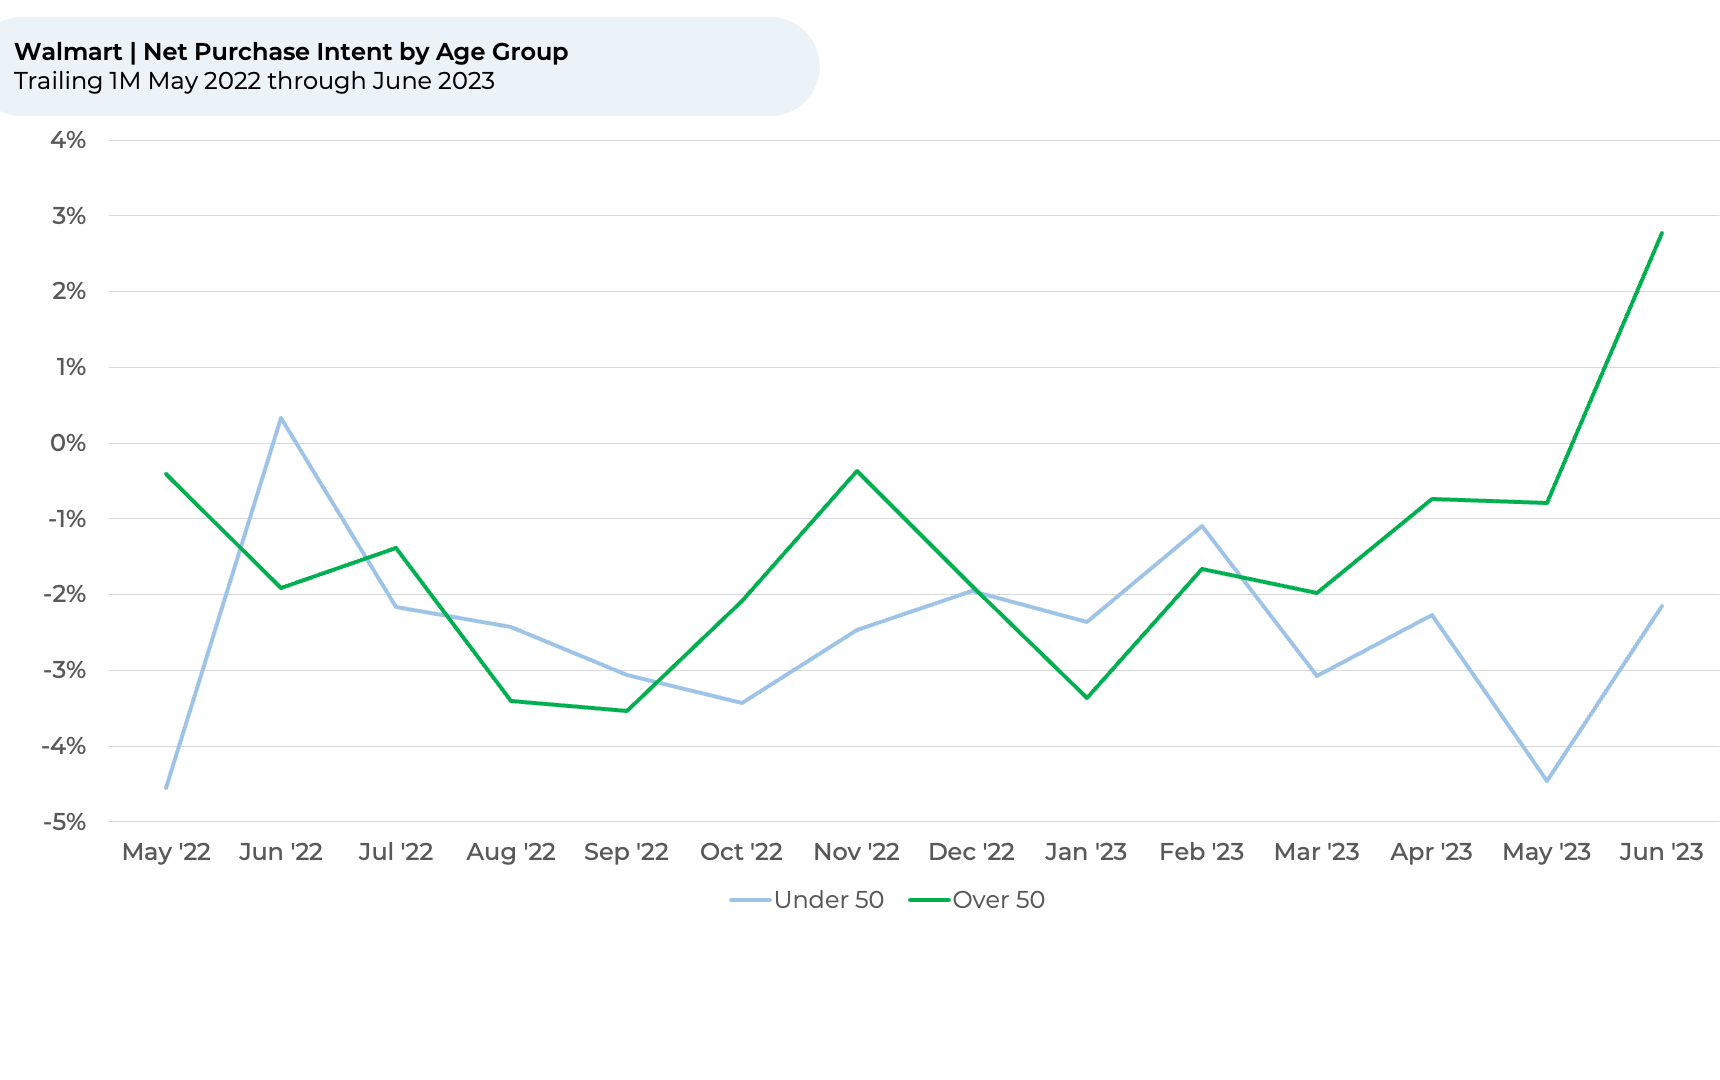
  • Walmart and BJ’s appear to be positioned to gain market share from the Target decline. 


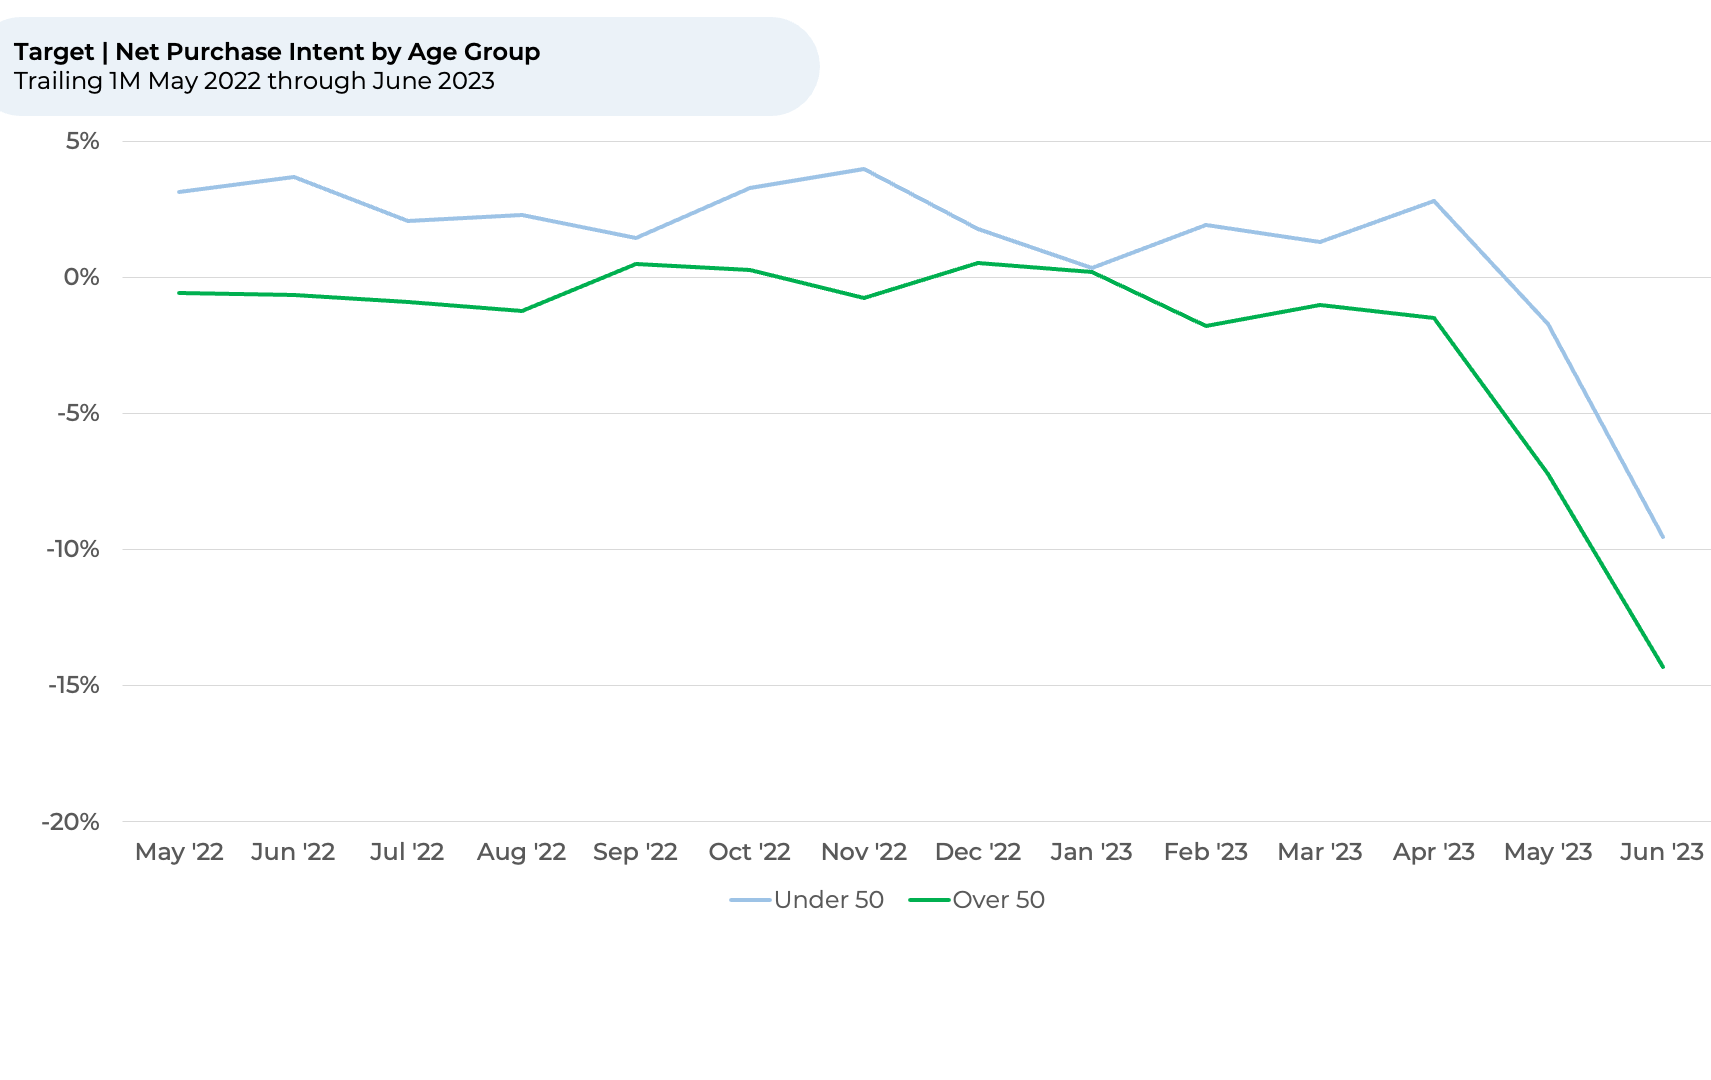
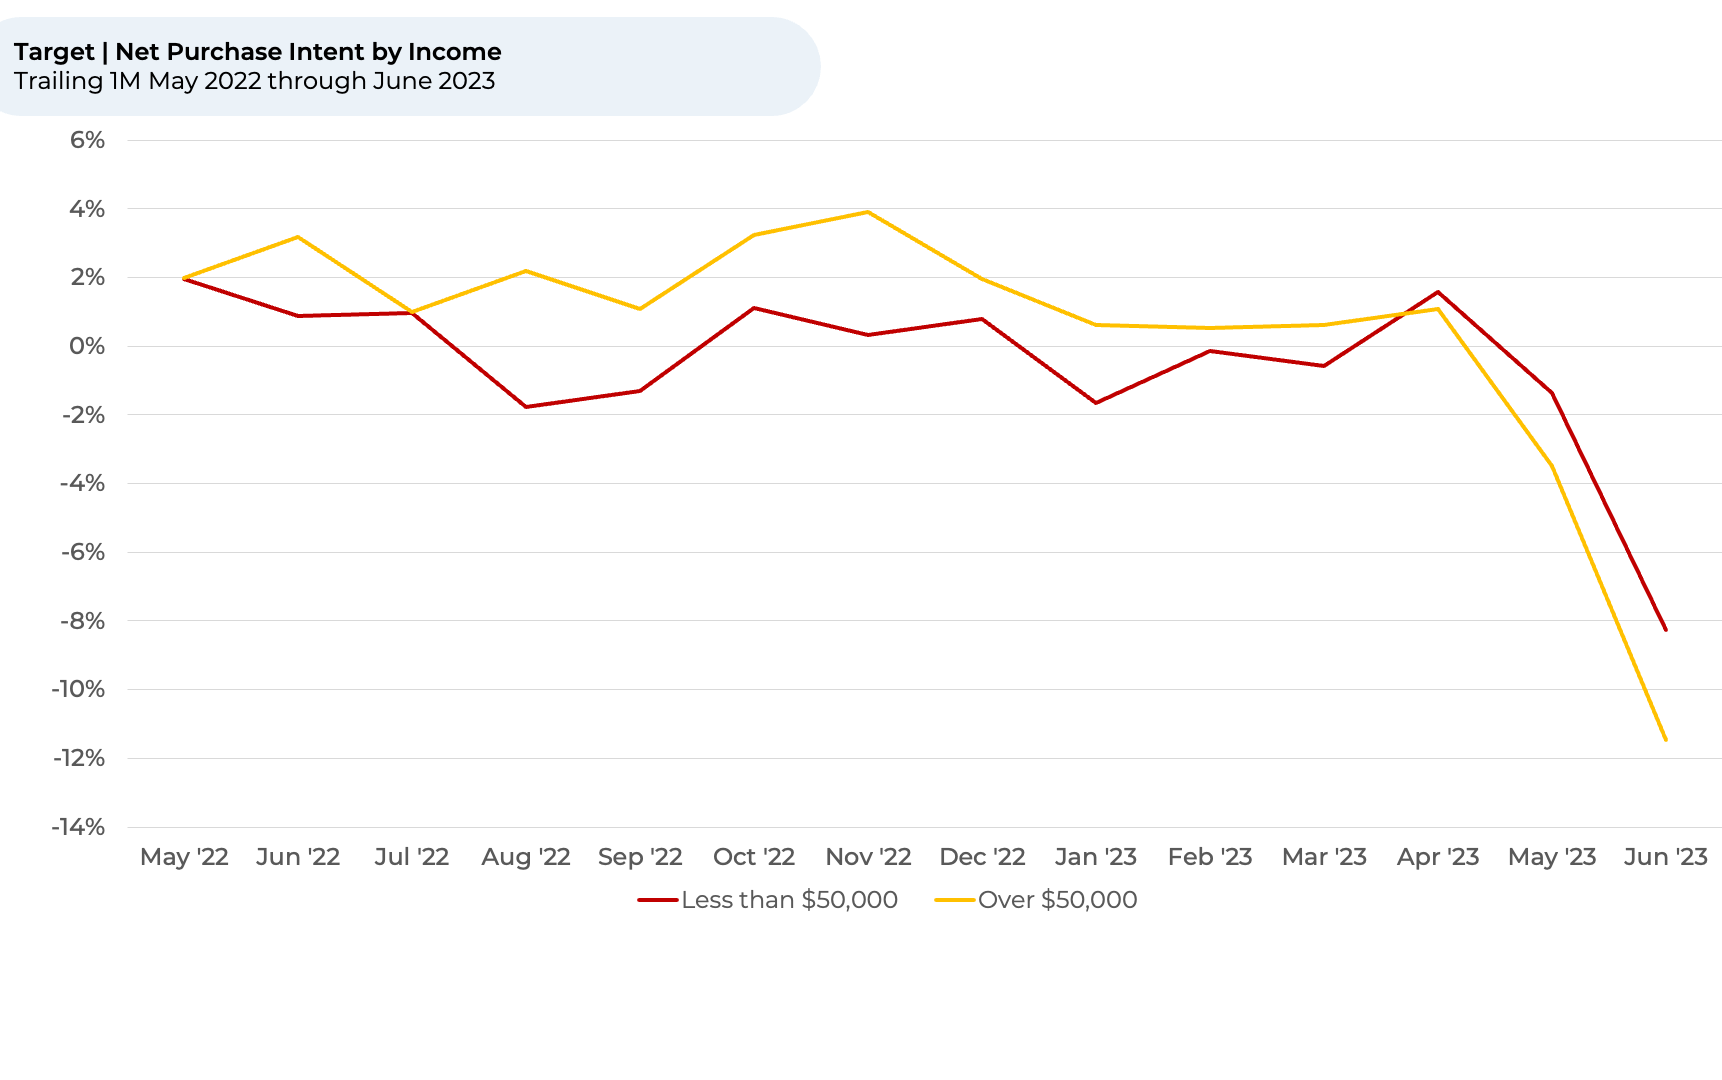
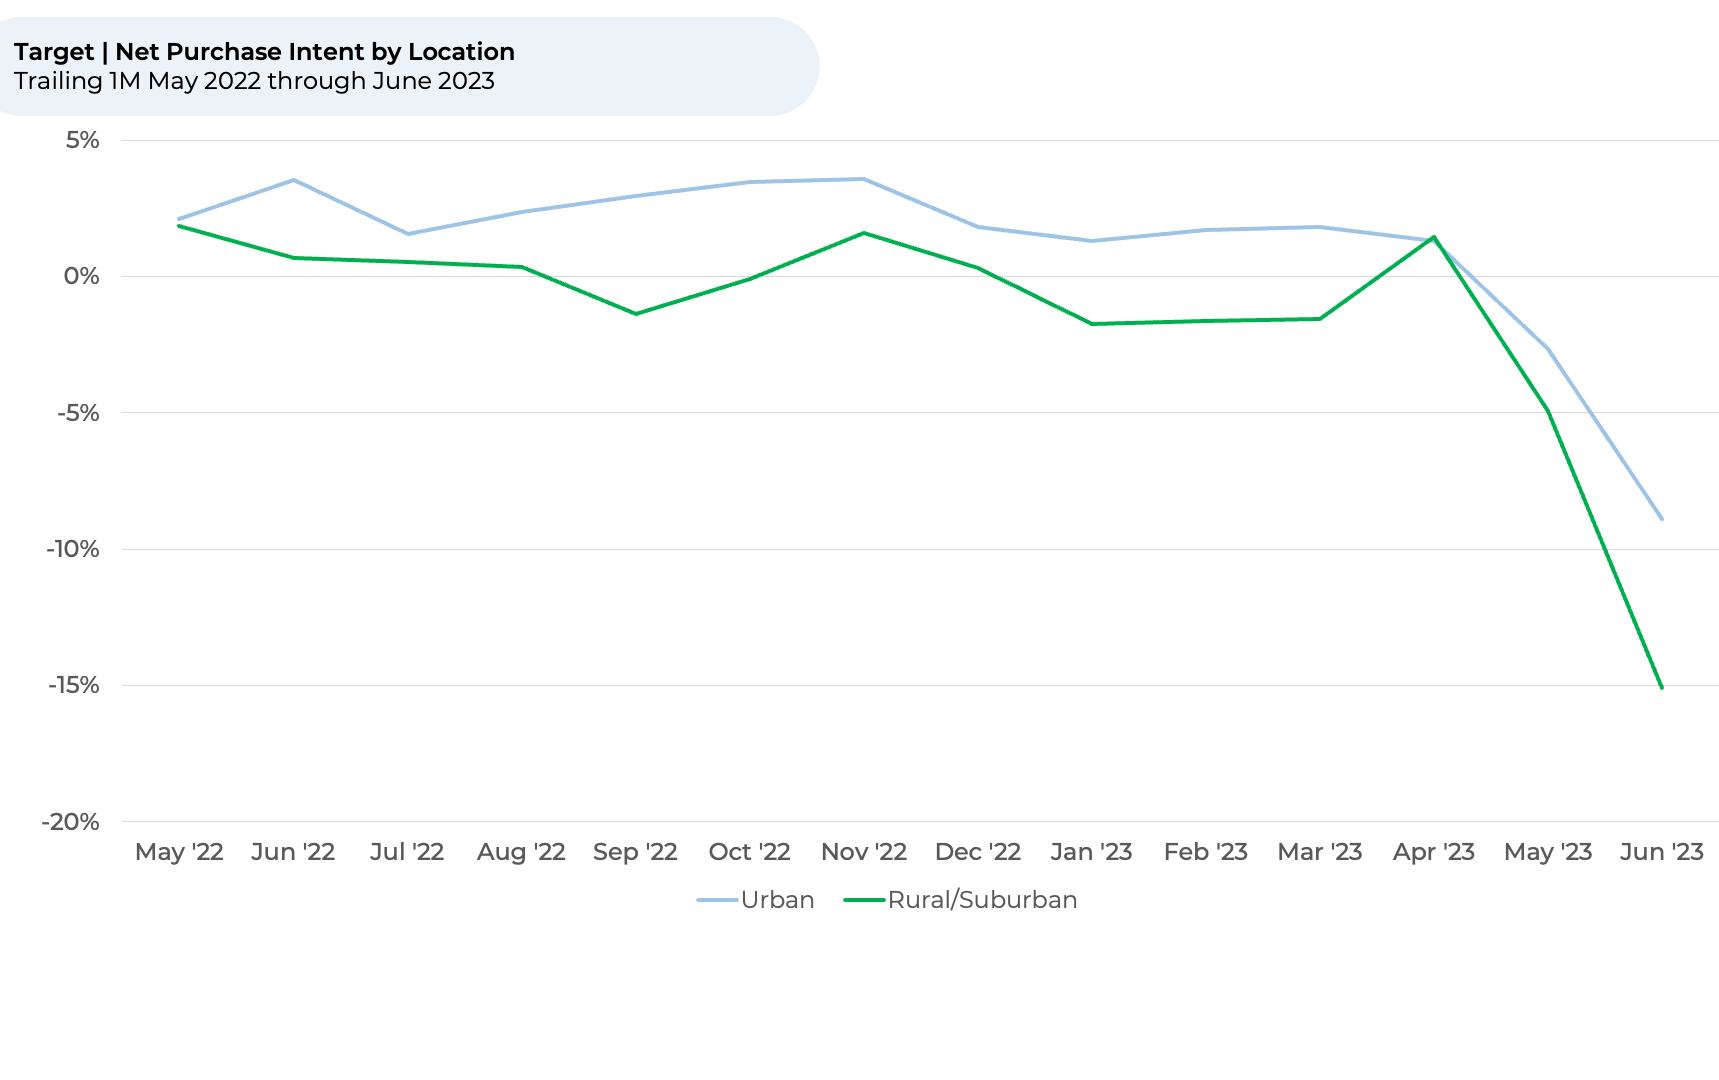
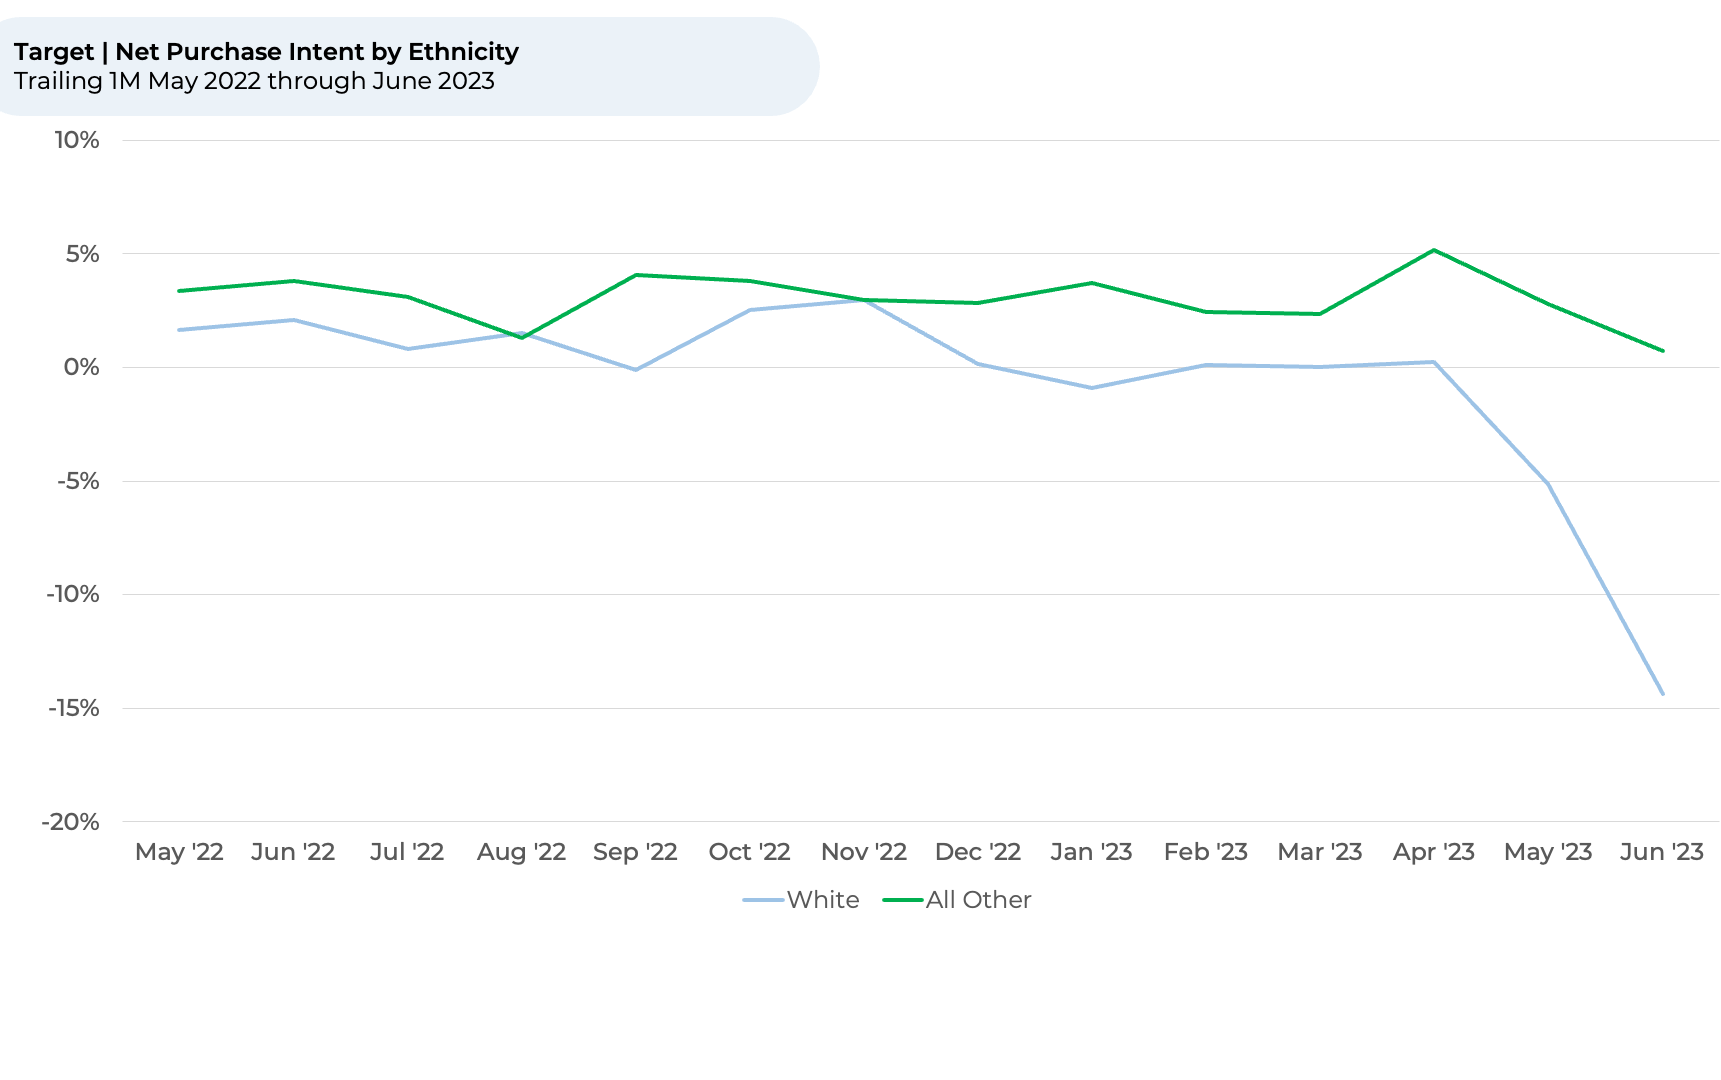
  • Demographics: Target’s purchase intent declined across almost all demographics since the end of April. It fell the most for customers that are older (-13%), rural/suburban (-17%) and making more than $50K annually (-13%). 


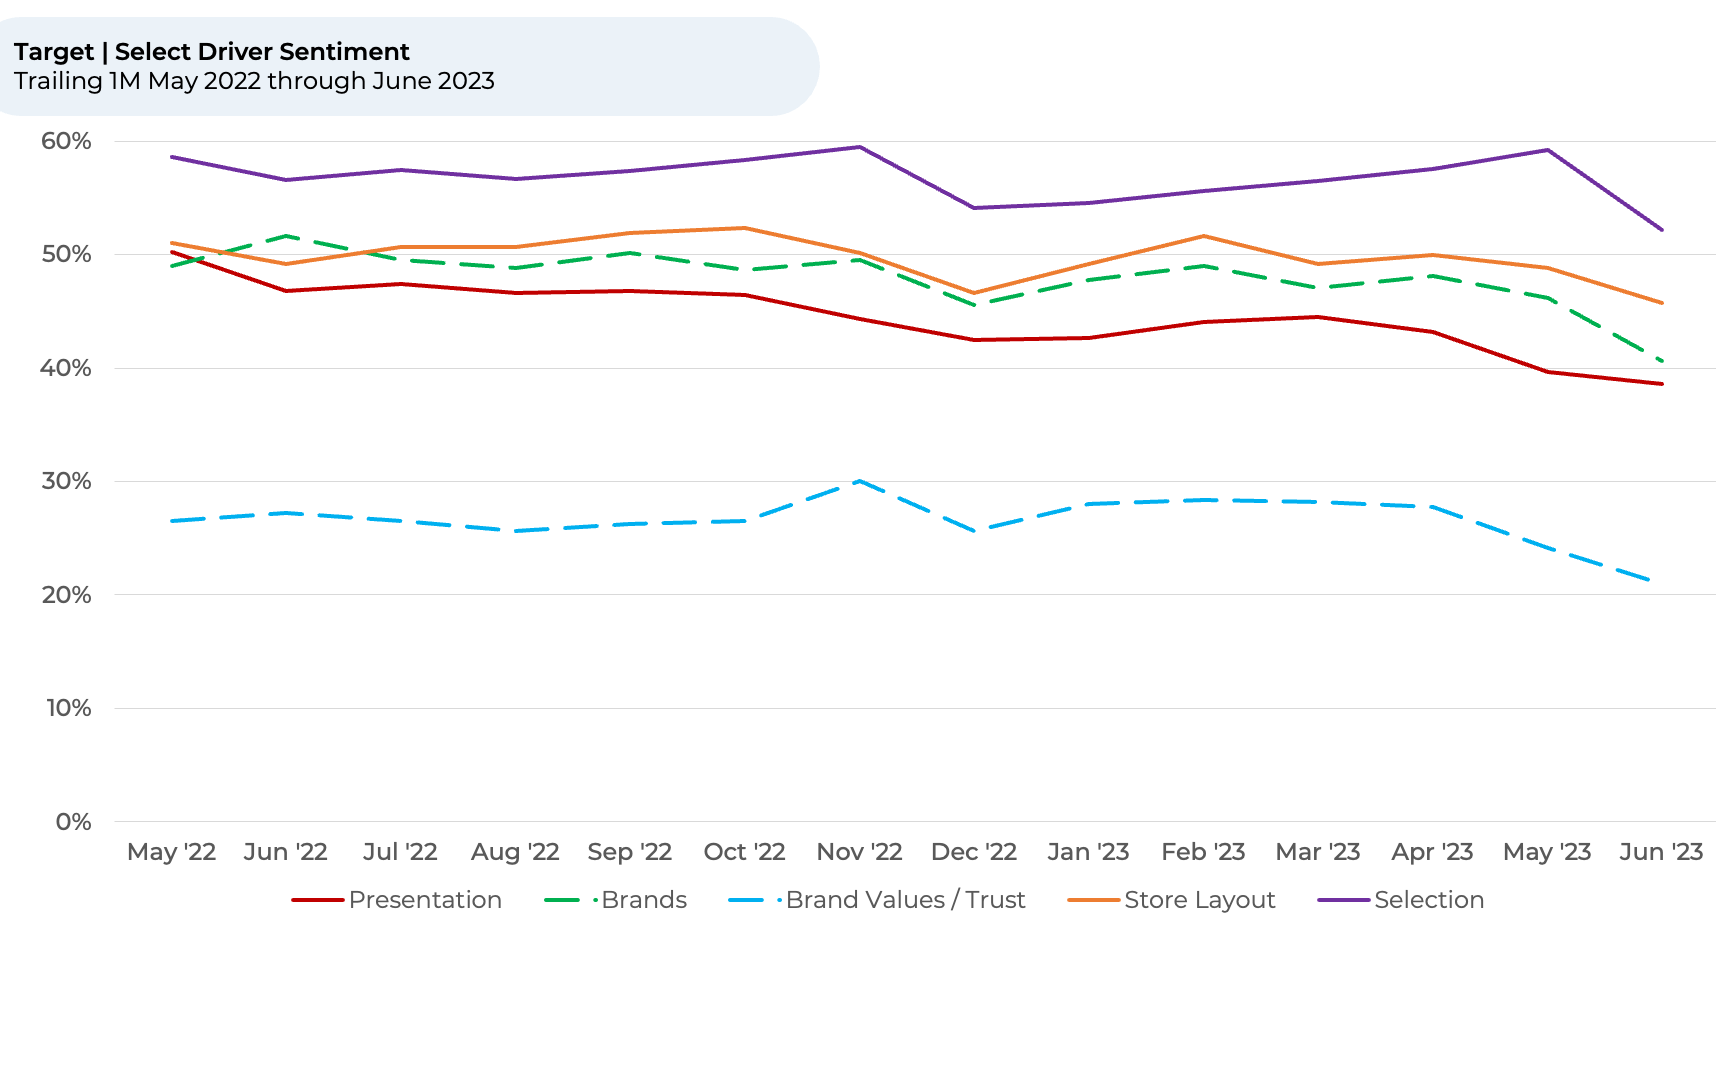
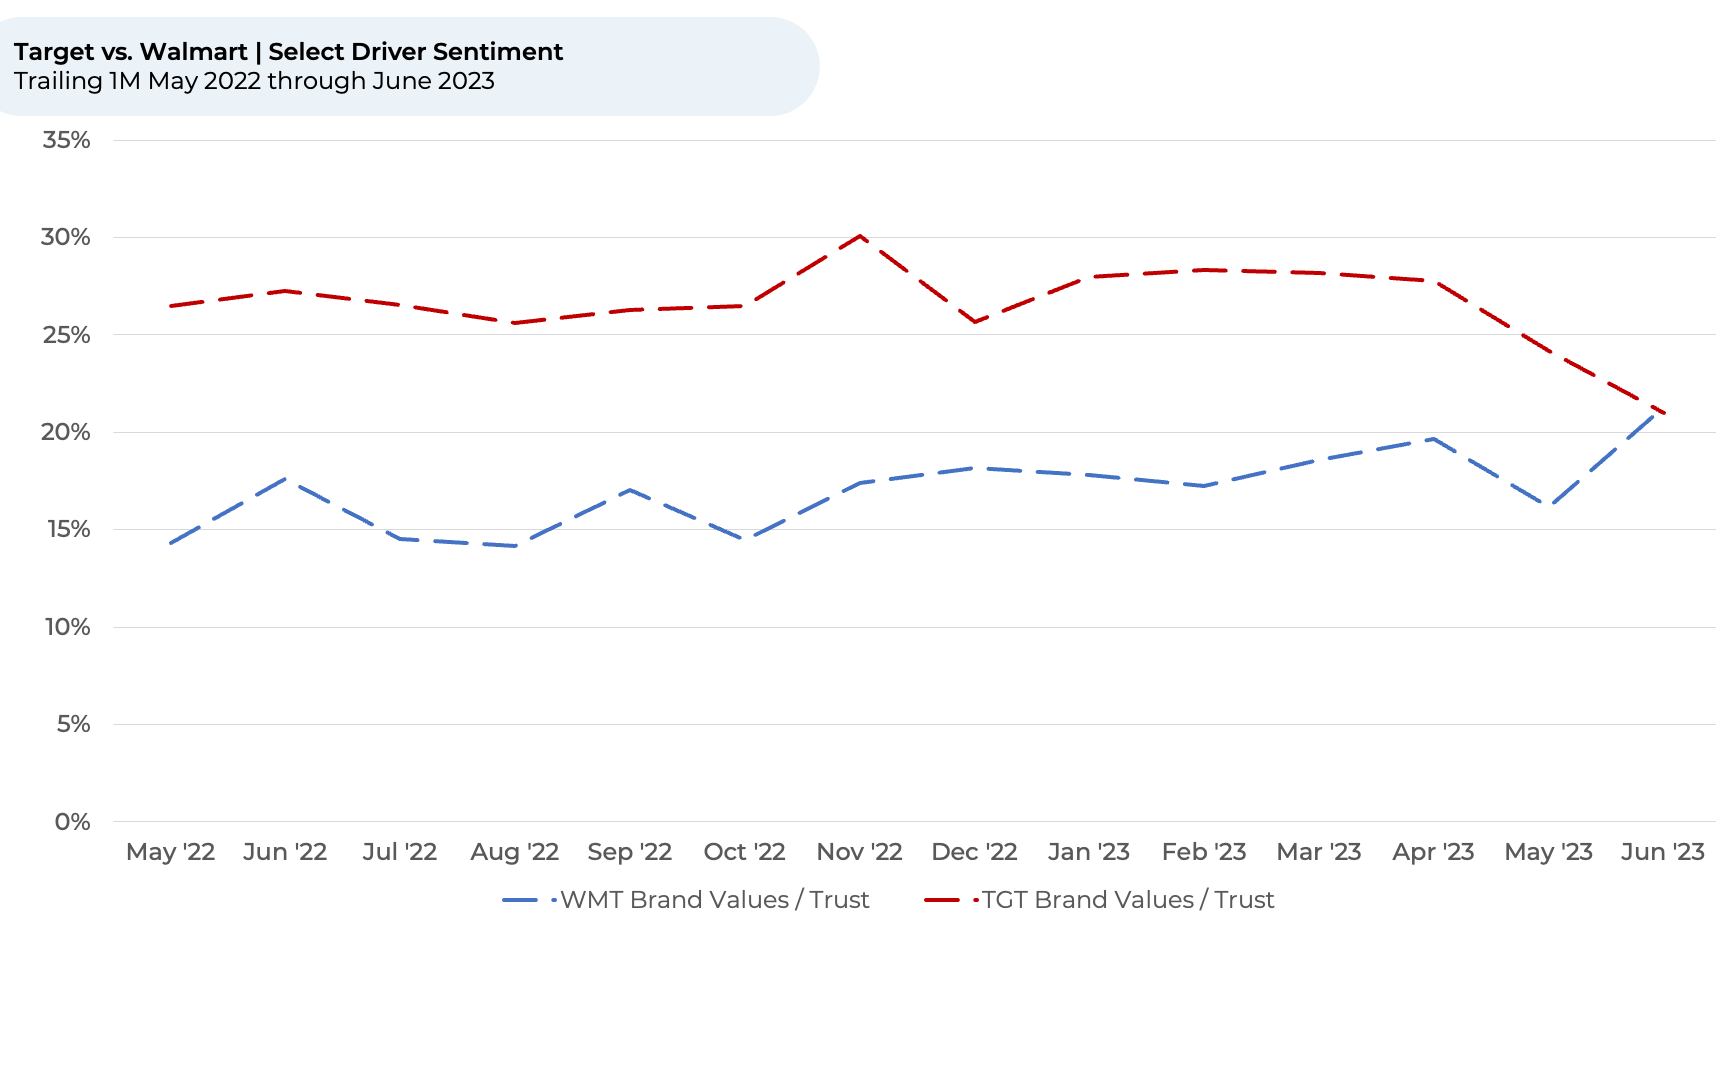
  • Key Drivers:  While Target's selection and presentation remain competitive strengths, sentiment towards the brands it carries and its brand values and trustworthiness have declined about 7% since April. Walmart’s Brand Values / Trust sentiment3 has exceeded Target’s for the first time in over a year.


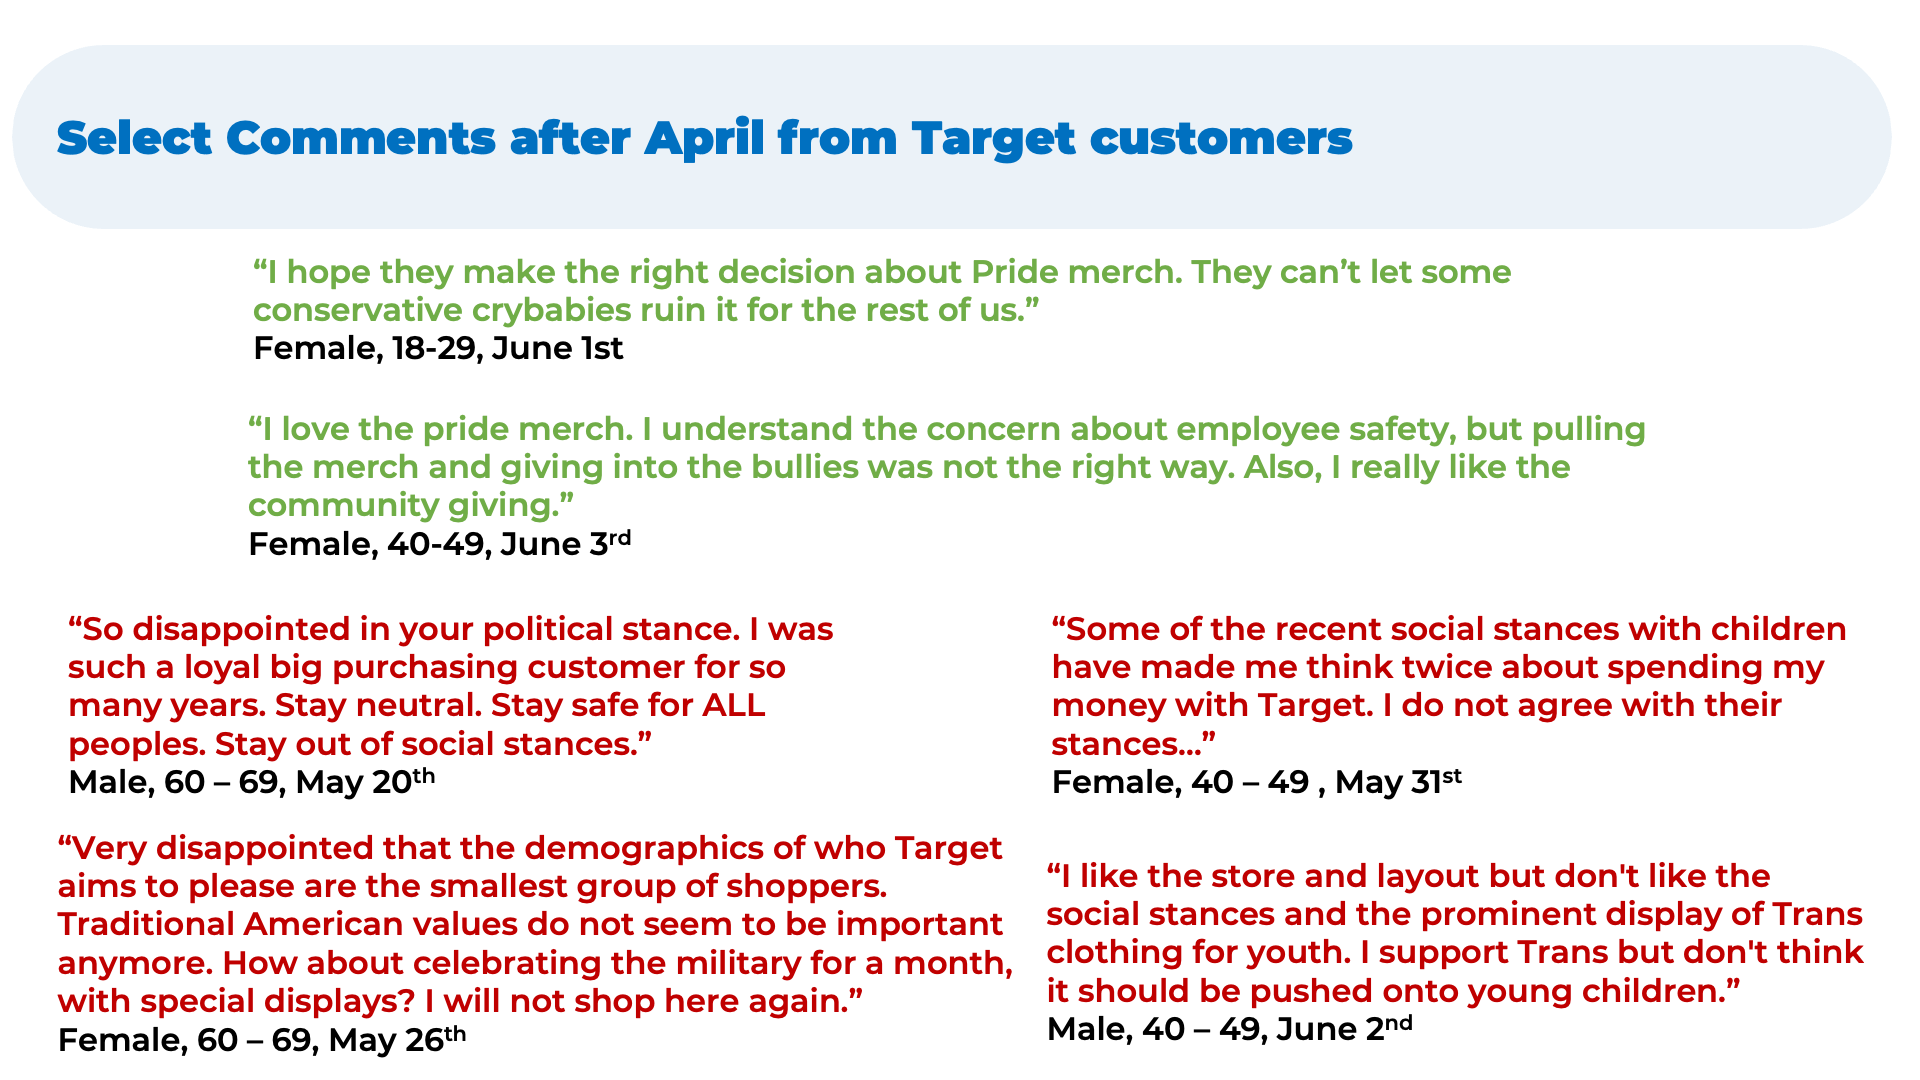
  • A significant portion of customer comments in May and June related to Target’s social/political stances.  While numerous comments were positive, the majority were negative. 


Discover HundredX insights into Superstore Retail Trends:

  • Slide title

    Write your caption here
    Button
  • Slide title

    Target’s Purchase Intent has fallen 13% since the end of April, accelerating in June (-8%). Key beneficiaries appear to be BJ’s, which had the largest increase in June (+4%), followed by Walmart (+3%).

    Button
  • Slide title

    Target’s Purchase Intent has declined across all age groups over the past two and a half months, with customers older than 50 declining more (13%) than those younger than 50 (11%). 

    Button
  • Slide title

    Meanwhile, Walmart has seen Purchase Intent jumped for 50+ year old customers (+4%) since the end of April.


    Button
  • Slide title

    Target’s Purchase Intent has also declined across all income groups since the end of April, falling more for customers earning more than $50K annually (-13%) than those making $50K or less (-10%). 


    Button
  • Slide title

    Since the end of April, Target’s Purchase Intent declined more for rural/suburban customers (17%) than it did for urban customers (10%).

    Button
  • Slide title

    Target has seen a much steeper decline with White customers (-17%) compared to customers of all other ethnicities (-4%).

    Button
  • Slide title

    Since end of April, Target saw the most decline in customer sentiment across its Brands and Brand Values / Trust dropping 8% and 7% respectively.

    Button
  • Slide title

    While Walmart has always been a leader in “Value”, sentiment towards Walmart’s “Brand Values / Trust” has pulled ahead of Target’s for the first time in over a year. 

    Button
  • Slide title

    Write your caption here
    Button

Please contact our team for a deeper look at HundredX's Superstore data, which includes more than 274,000 pieces of customer feedback across 8 superstore chains.


  1. All metrics presented, including Net Purchase (Purchase Intent) and Net Positive Percent / Sentiment are presented on a trailing one-month basis unless otherwise noted.
  2. Purchase Intent for superstores represents the percentage of customers who expect to spend more with that chain over the next 12 months, minus those that intend to spend less. We find businesses that see Purchase Intent trends gain versus the industry or peers have often seen revenue growth rates, margins and/or market share also improve versus peers. 
  3. HundredX measures sentiment towards a driver of customer satisfaction as Net Positive Percent (NPP), which is the percentage of customers who view a factor as a positive (reason they liked the products, people, or experiences) minus the percentage who see the same factor as a negative.

Strategy Made Smarter


HundredX works with a variety of companies and their investors to answer some of the most important strategy questions in business:

  • Where are customers "migrating"?
  • What are they saying they will use more of in the next 12 months?
  • What are the key drivers of their purchase decisions and financial outcomes?


Current clients see immediate benefits across multiple areas including strategy, finance, operations, pricing, investing, and marketing.


Our insights enable business leaders to define and identify specific drivers and decisions enabling them to grow their market share.


Please contact our team to learn more about which businesses across 75 industries are best positioned with customers and the decisions you can make to grow your brand’s market share.

####


HundredX is a mission-based data and insights provider. HundredX does not make investment recommendations. However, we believe in the wisdom of the crowd to inform the outlook for businesses and industries. For more info on specific drivers of customer satisfaction, other companies within 75+ other industries we cover, or if you'd like to learn more about using Data for Good, please reach out: https://hundredx.com/contact.

Share This Article

06 May, 2024
Sure, lattes, mochaccinos, and cappuccinos are pricey, but they taste delicious. For many consumers, the great taste of coffee shop coffee made it worth the cost. But customers at Starbucks aren't so sure the tradeoff is worth it anymore. Examining more than 420,000 pieces of feedback across the Quick, Fast, Casual (QFC) industry, including over 21,000 on Starbucks, we find: Starbuck's Purchase Intent 1,2 is down 3% over the past six months, with most of that dip occurring over the past few months. By contrast, Dunkin' Donuts has remained within a tight range over the past six months, as did an average of other, smaller coffee chains. Customers increasingly see less value in Starbucks. Starbuck's Value perception 3 fell 5% over the past six months, compared to just 1% for Dunkin' Donuts. However, it also fell 5% for the average of the smaller coffee chains. Coffee drinkers feel significantly unhappier about Starbuck's quality and taste. Starbuck's Taste perception fell 4% over the past six months, while rising 1% for competitors. Likewise, its Quality perception dipped 3% over the same time period (and 8% over the year). Ultimately, Starbuck's perceived drop in taste is leading inflation-weary consumers to say they plan to spend less at the coffee chain, as the value just isn't as good.
06 May, 2024
Forbes Best Brands for Social Impact, Powered by HundredX
06 May, 2024
Ozempic once dominated the headlines, but GLP-1 competitor Mounjaro is winning over customers. GLP-1 drugs, used for treating diabetes and aiding in weight loss, are relatively new on the market yet have surged in popularity over the last year. They're becoming so popular that J.P. Morgan estimates that 30 million people in the US may be using a GLP-1 drug by 2030. This statistic presents a significant potential for early drug creator Novo Nordisk (Ozempic, Wegovy), and perhaps an even bigger one for Eli Lilly (Mounjaro, Zepbound). HundredX data indicates Eli Lilly is in a position to win over Novo Nordisk as Mounjaro's Usage Intent widens against the competition. Ozempic may have name recognition, but customers feel more positively about Mounjaro's effectiveness and lifestyle impact, even if they aren't excited about its high price. Examining 1,500 pieces of customer feedback across Mounjaro, Ozempic, and Wegovy, we find: GLP-1 users increasingly say they plan to use Mounjaro more, and Ozempic less . Mounjaro’s Usage Intent is up 19% since July, Wegovy’s is up 3%, and Ozempic has stayed within a tight range. Customers feel Mounjaro is more effective than competing drugs, but it’s harder to get . Mounjaro outperforms other GLP-1 drugs in effectiveness, lifestyle impact, and side effects. However, customers dislike its cost and availably more than competitors.
Share by: